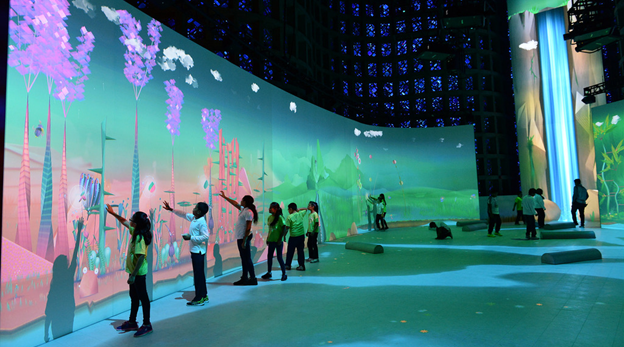
Connected Worlds is the most popular exhibit at the New York Hall of Science (NYSCI), but some museum-goers have trouble seeing past the stunning visual displays.
“The objective is unclear to me,” wrote (archived) Courtney R. Moore after a class trip in January 2017, noting at the same time that the experience was fun and powerful nonetheless. “It was just nice to be there,” she added.
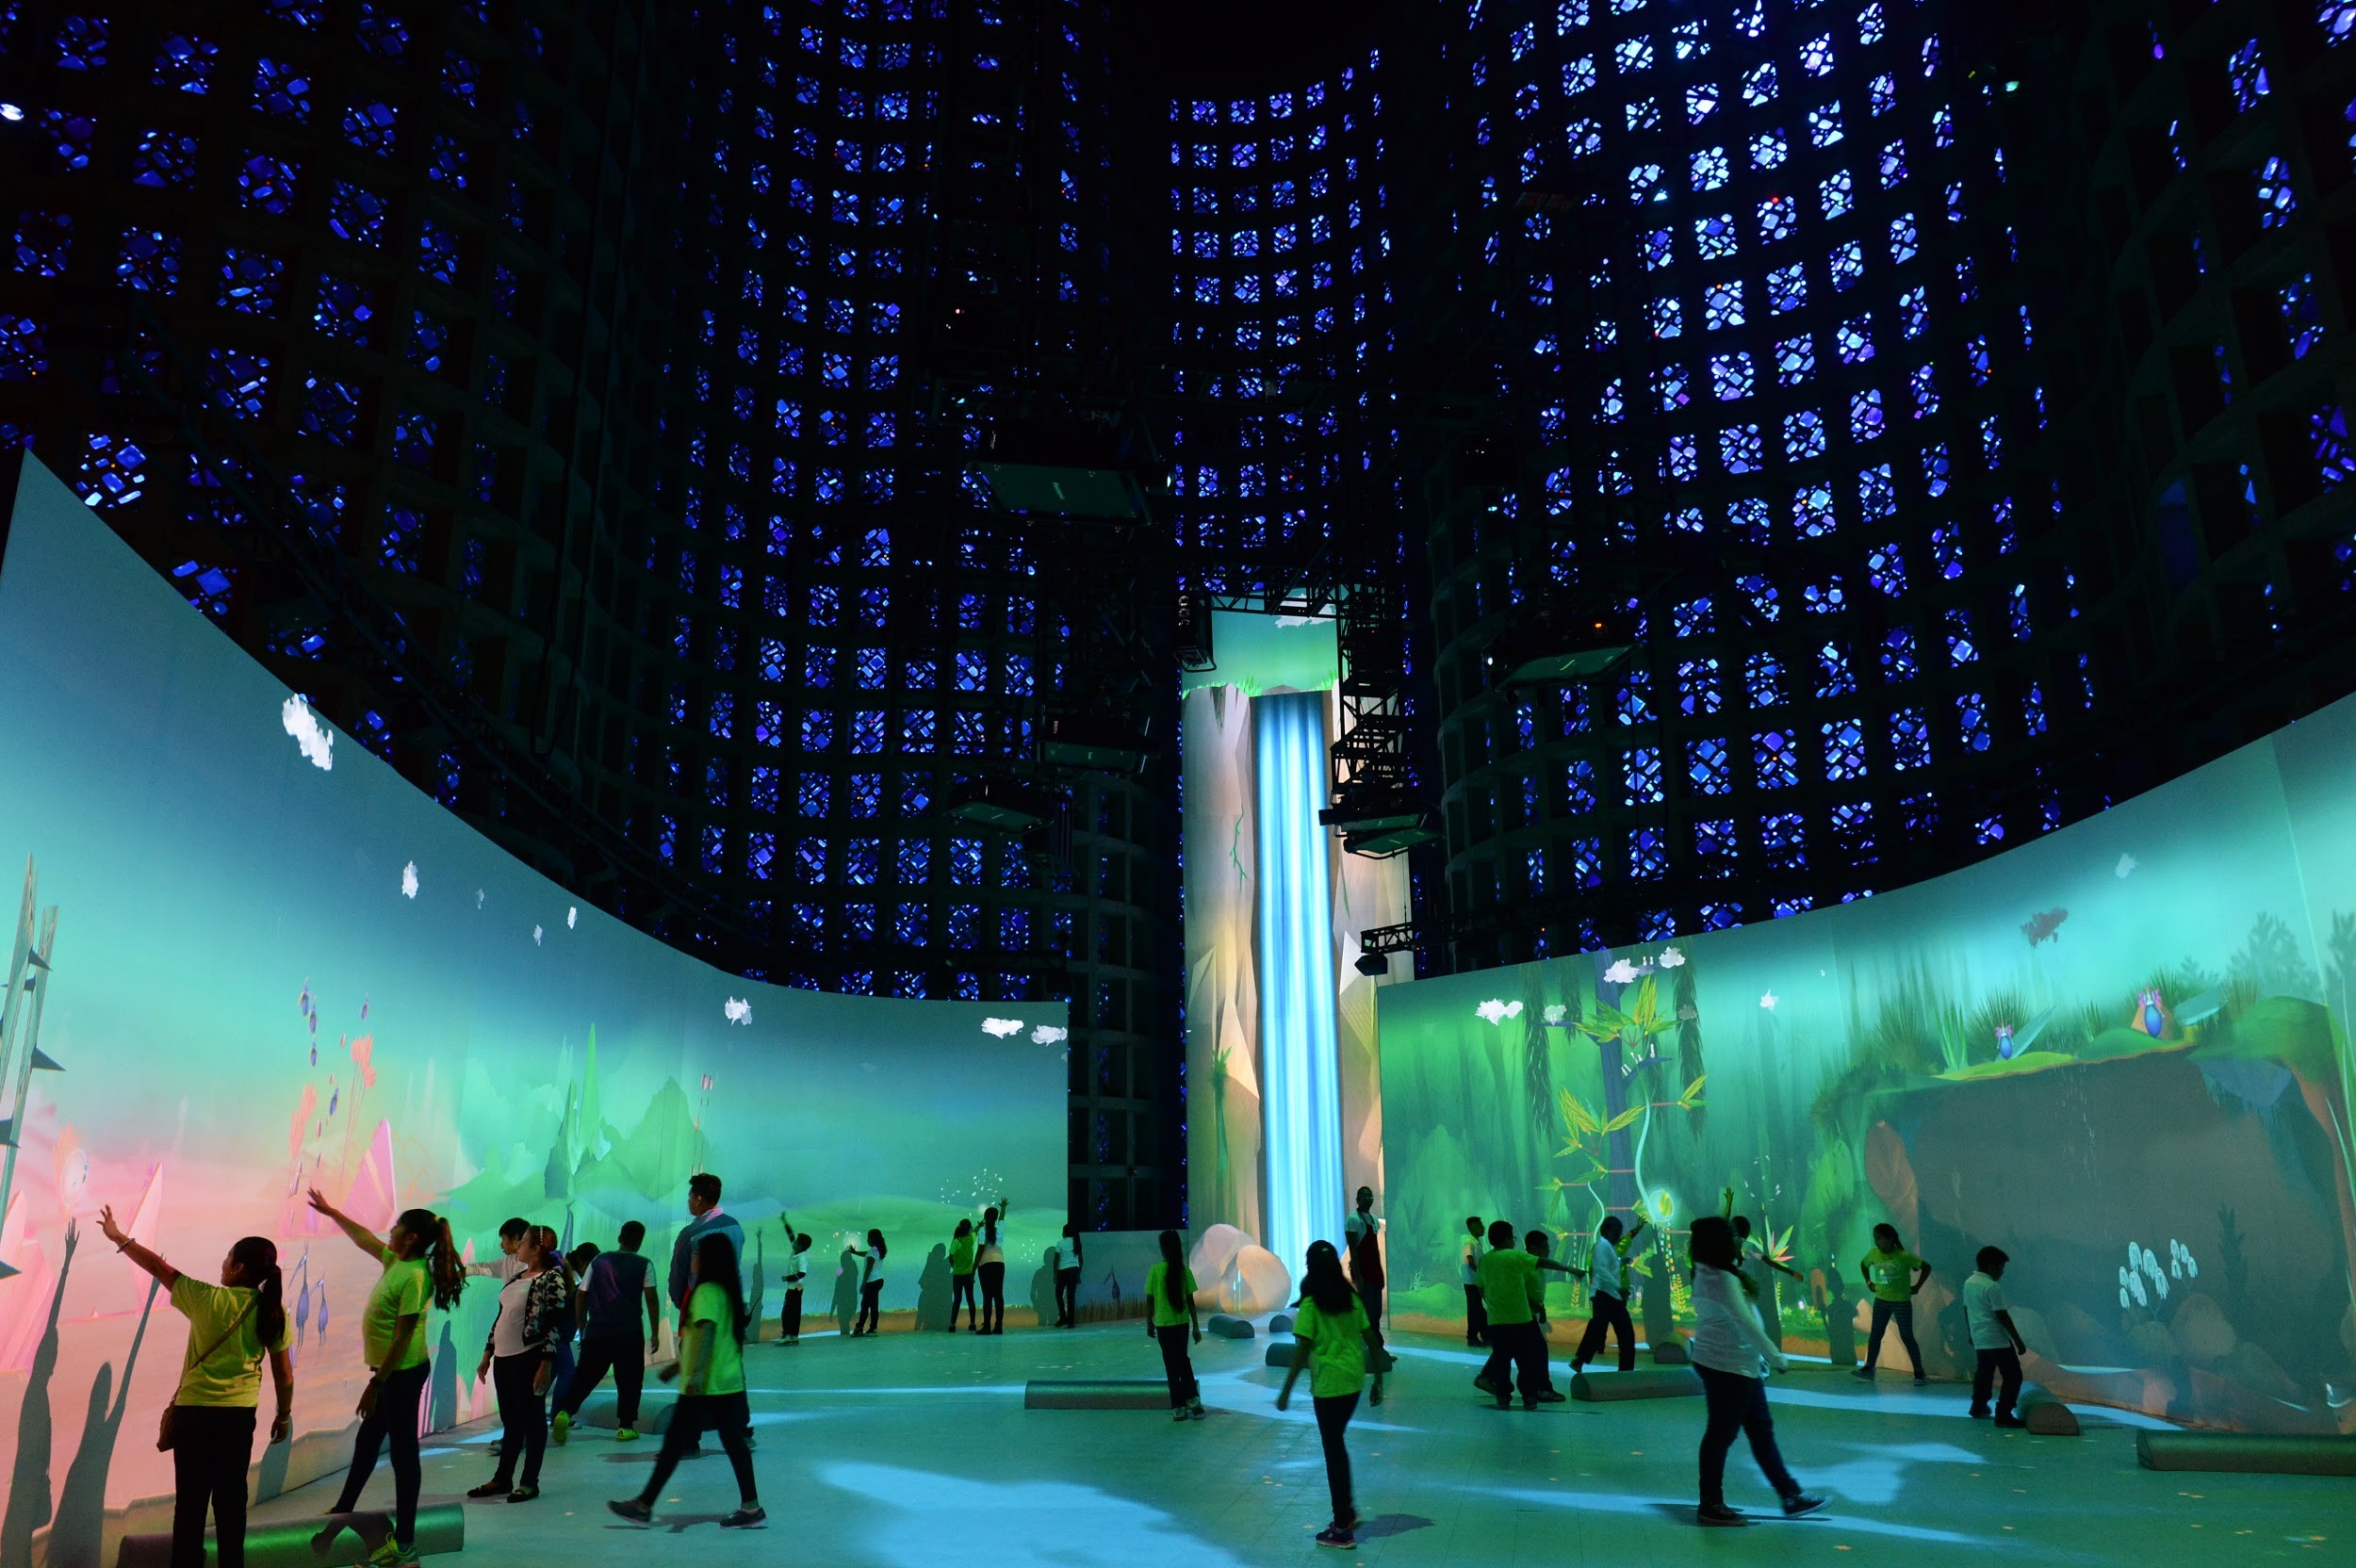
The exhibit aims to teach visitors about sustainability and introduce them to systems thinking by immersing them in an interactive world that is programmed to behave like a simplified version of an ecosystem. During a typical Connected Worlds session, which lasts between 10 and 30 minutes, visitors can “plant seeds” in four areas—also known as “biomes”—by gesturing with their arms in front of digitally-animated screens. Within a second or two, a seed will appear in the biome and grow into a tree. Visitors can also “divert water” from a virtual waterfall into and out of the four biomes (as well as two water storage areas) by shifting the position of “logs” on the floor of the exhibit. The idea is that what people do—and what they don’t do—can affect the fate of each biome and the health of the ecosystem as a whole.
Using data to see the bigger picture
In practice, it can be hard for the exhibit’s visitors, who are primarily children, to step back and reflect on how their actions are affecting the bigger picture. And with more and more people lining up for Connected Worlds, visitors have less time to engage in that reflection. Originally, the creators of Connected Worlds envisioned it as an open space where visitors would be free to wander in and out at will, said Leilah Lyons, Director of Digital Learning Research at NYSCI. But to manage the crowds, NYSCI instead decided to offer the experience in the form of timed sessions, which have gone from 40 minute explorations to fast-paced sessions that, on the busiest days, average around 15 minutes in length. Exhibit Explainers, who provide an overview of how things work at the beginning of each session, must balance their introductions with visitors’ desire to maximize their time interacting with the space.
“We’re always bumping up against our educational and learning goals and the hard realities of running a museum,” said Margaret Honey, the President and CEO of NYSCI. As a result, she added, there was no “contextual model” for understanding visitor behavior in Connected Worlds.
But there was data.
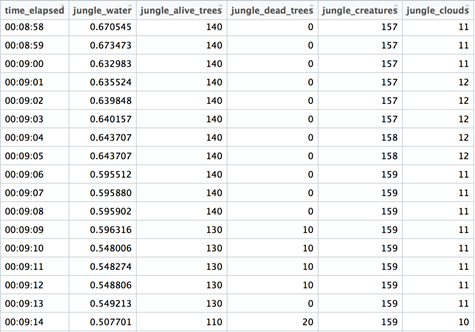
The museum had been recording session logs, which are second-by-second snapshots of the state of the biomes (jungle, plains, wetland, desert), the water storage areas (mountain valley and reservoir), and the elements contained therein (trees, creatures, clouds, water).
With thousands of session logs collected, the next step—how to interpret them—posed some challenges. Because the exhibit was originally intended to be open-ended, hard and fast “rules” to determine when important events like population booms and busts occurred were not hard-coded into the program running the simulation. These “tipping points” could only be identified on a session-by-session basis.
In some ways, the session logs resemble the kinds of financial data that Two Sigma is experienced in dealing with: multiple variables that fluctuate continuously over time, sometimes independently and sometimes in concert with one another.
For this reason, NYSCI approached the Two Sigma Data Clinic for help uncovering tipping points in the data, a key element in helping to enhance the educational experience of Connected Worlds.
Measuring mass tree deaths
Consulting with NYSCI staff and researchers familiar with the exhibit, the Data Clinic team anchored their work in defining, identifying, and investigating the occurrence of tipping points in Connected Worlds.
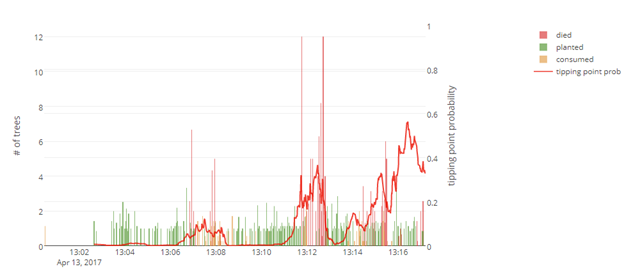
In Connected Worlds, planting seeds attracts animals into the biome; the more trees that grow, the more biodiverse the ecosystem becomes. But trees need water to survive, and they don’t always get enough. When visitors fail to keep the biomes in balance by diverting water, trees turn brown and die off, sometimes in staggering amounts.
Since trees are directly tied to visitor activity, the team decided to define tipping points as the start of sudden surges in tree deaths. If more than half of the trees in a given biome had died within the last 30 seconds, they flagged the beginning of that 30-second interval as a “mass tree death tipping point.”
The next step was to investigate the specific actions triggering these events by looking at tipping points across sessions.
Investigating the predictors of mass tree death “tipping points”
All about the water
But isn’t why trees die obvious? If trees in Connected Worlds are programmed to require water, is it not evident that they would die for lack of it? To be sure, it is all about the water. But how exactly does water function in Connected Worlds, and how well do visitors make use of it?
It all starts with the waterfall, the common water source for every part of the ecosystem. At the beginning of each session, water pours out of the waterfall and onto the floor. What happens next depends on how visitors behave.
In a healthy ecosystem, visitors plant trees and divert enough water from the waterfall to sustain the trees they plant. The trick is getting the right amount of water to the biomes in order to keep the trees alive. Like in a natural ecosystem, in Connected Worlds trees transpire, meaning the water they take in will eventually turn into clouds. These clouds then migrate toward and “rain into” the waterfall, replenishing its water supply. If visitors plant trees but do not divert enough water to sustain them, the amount of water in the waterfall will grow by the end of the session. This is because the trees will absorb water “too quickly”—i.e., at a faster pace than is diverted into the biomes—and this water will rapidly turn into clouds, which “rain into” the waterfall. In an ideal scenario where visitors plant trees and divert water at sustainable rates, the amount of water in the waterfall will remain unchanged by the end of the session, since visitors will have planted just enough trees and diverted just enough water for those trees to absorb.
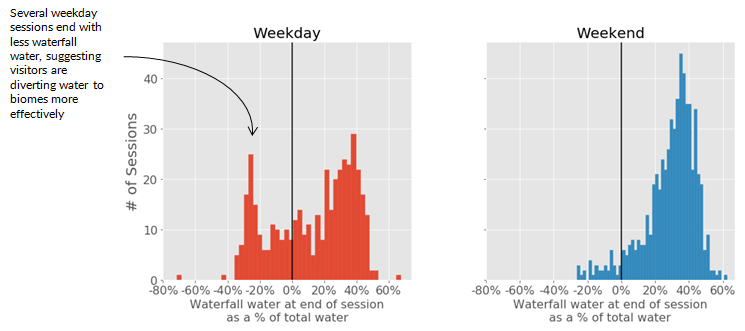
This water cycle framework makes sense—if you plant trees, you should also be diverting water. But the data on actual visitor behavior suggests that people are not taking this seemingly straightforward principle to heart. In most sessions, the amount of water in the waterfall at the end of the session is higher than it was at the start, implying that visitors are not diverting water at sustainable rates.
This pattern is more pronounced during the weekend, where the vast majority of sessions end up with a large amount of water flowing back into the waterfall. According to NYSCI staff, weekend sessions tend to have less experienced Explainers and lots of families with young children. Weekends also have more back-to-back sessions, while weekdays are less hectic and include a number of visits from school field trips, where students are usually explicitly encouraged to coordinate activities.
Water flows back into the waterfall in the majority of Connected World sessions, suggesting insufficient water usage
How water affects trees
What happens when trees get planted, without a corresponding increase in water? Mass tree deaths, one might (sensibly) guess. Indeed, weekend sessions—where visitors tend to over-plant trees and under-utilize water—also had a higher number of tipping points on average.
The Data Clinic team built a logistic model to predict whether there would be a tipping point within the next 30 seconds of a session, given the amount of “tree planting” and “water diversion” and controlling for the current state of the biome.
To quantify “tree planting,” the team calculated a ratio that represents the number of trees planted within the last 30 seconds as a proportion of the total number of living trees, for a given biome at a given second. So if 70% of the trees were planted within the last half-minute, this would represent more aggressive planting than if, say, only 10% were.
“Water diversion” is more a complicated metric, because the session logs only provided the total water in each biome at a given second, which could either be water moved into or out of biomes by visitors or water carried into and out of biomes by clouds. For predicting tipping points, diverted water is more relevant than cloud water, since visitors are directly moving water around the ecosystem, while clouds, which form as a result of trees transpiring, are not a direct consequence of visitors’ actions.
To isolate diverted water, the team observed changes in each biome’s water levels over time so they could estimate the average water carried per cloud, and interpolate the amount of water during the gaps between times when there was cloud movement and times when there was not. Using these estimates, they were then able to “reverse-engineer” the amount of diverted water during intervals with both cloud movement and visitor activity.
As expected, the model found that aggressive tree planting leads to a higher likelihood of tipping points in the model, while diversion of water into a biome leads to a lower likelihood of tipping points. In Connected Worlds, just as in real life, overpopulation without sufficient resources results in an unsustainable ecosystem.
The logistic model successfully predicts the occurrence of many mass tree death “tipping points”
How to encourage more sustainable behavior
A major takeaway from the team’s analysis is that visitors tend to underutilize water and over-aggressively plant trees. People, it turns out, are generally not very good at working together in Connected Worlds.
“We see it anecdotally, that there’s more people planting trees than there are people navigating water,” said Priya Mohabir, Vice President of Youth Development at NYSCI, but “it’s not something [we] recognized as a pattern.”
It’s easy to imagine why tree planting would be so popular. After all, Connected Worlds visitors, first and foremost, are there to have a good time.
Tree planting provides immediate gratification, as seeds almost instantaneously sprout and grow. Water diversion, on the other hand, requires more work and garners less short-term reward. Additionally, according to museum staff, children sometimes find it fun to hoard water by damming the waterfall.
This behavior would be more of a problem if each biome during the free play sessions didn’t already start out with plenty of water to spare. Visitors are able to plant trees even without diverting any waterfall water into biomes at first. This was a somewhat contentious decision, made to ensure that visitors were able to have immediately engaging and rewarding interactions, said Dr. Lyons. As a site of both education and entertainment, NYSCI has to try to balance the educational objectives of exhibits against the enjoyment visitors derive—or conversely, the frustration they might experience while using the exhibit.
Dr. Lyons added that researchers attached to the project had long advocated for starting the simulation with “dry” biomes and using a lower level of water to motivate visitors to move water around, but there were concerns that visitors would find this unengaging. Without evidence either way, the visitor experience side of the argument won out. The Data Clinic’s analysis provides evidence that the higher water levels actually hold visitors back from exploring a core component of the experience, the distribution and sharing of water resources. This provides the needed institutional impetus to experiment with lowering the initial water level during free play sessions, in order to find the right level that successfully incentivizes visitors to pay more attention to water while preserving visitor satisfaction, according to Dr. Lyons. From a technical standpoint, this would be a trivial change.
Taking things one step further, even if trees die in startling amounts, there do not appear to be any lasting consequences incurred. Depending on whether or not visitors interact with biomes differently post-tipping point (a topic worthy of future study), NYSCI could consider making it harder to replant trees in areas where mass deaths have occurred. This would require a more significant redevelopment. On the other hand, a “scorched earth” policy might not be the right way to go from an education perspective. “In a shared exhibit, we want to provide recoverable failures to encourage repeated attempts. It’s via these repeated attempts that the learning occurs,” said Dr. Lyons.
Technical modifications notwithstanding, another way to remedy this coordination issue would be to encourage parents, teachers, and exhibit Explainers to provide more guidance to visitors during the session itself, for example by nudging them to make sure they are moving water around.
NYSCI staff are currently reviewing these and other recommendations made by the Data Clinic team for the next iteration of Connected Worlds. Dr. Lyons is investigating how to integrate the tipping point model developed by the Data Clinic into a data-driven tablet-based application that Explainers, teachers, or parents can use while within Connected Worlds.
As interactive exhibits are adopted by a larger number of museums, maintaining an atmosphere that is as educational as it is fun and playful will become an increasingly important challenge. The large bodies of data generated by these interactive exhibits could hold the key to addressing this challenge, however, allowing museums to make evidence-based decisions about development directions, enhancing research into visitor learning, and helping institutions adjust priorities for exhibits. The Data Clinic + NYSCI project analyzing visitor behavior in Connected Worlds is a useful case-study of how data storytelling can support this endeavor.
Learn more about the Two Sigma Data Clinic here