
That commodity index returns have suffered both during 2017 and the past decade likely comes as no surprise to asset allocators. What may surprise some is how commodity indices have suffered.
Take the S&P GSCI Total Return Index as an example. The index has declined 2.38 percent year-to-date and 57.7 percent since 2007, but the spot prices of the underlying commodities have increased by 0.88 percent year-to-date and only fallen by 6.53 percent since 2007.¹ In other words, the largest drag on commodity index performance has not been the decline in commodity prices but rather the cost of rolling futures contracts in order to hold those positions.
This negative drag exists at both the aggregate level (e.g., S&P GSCI Index) and for most individual commodity indices (e.g., agriculture and energy indices). Asset allocators trying to maintain a persistent exposure to commodities might want to bear in mind the magnitude of the headwinds of rolling futures contracts that have in the past persistently affected portfolio returns.
Decomposition of total index returns
Academic research like Erb and Harvey (2006) highlights the problem. The total return to a commodity index decomposes into three parts:²
Total Return ≈ Spot Price Return + Futures Roll Yield + Collateral Return
or
Excess Return ≈ Spot Price Return + Futures Roll Yield
where the collateral return equals the return to investing in US Treasury bills. Figure 1 plots each ofthese terms since 1970 for the monthly S&P GSCI Index.
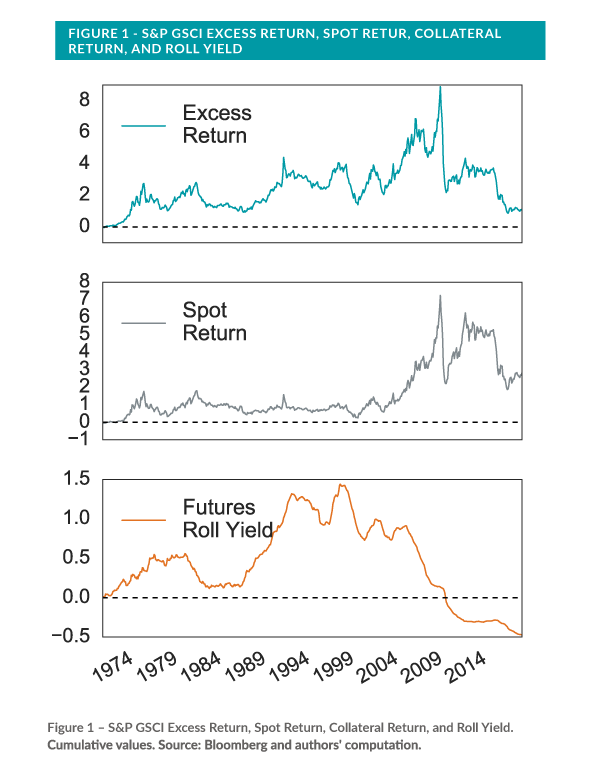
The figure highlights two important facts. First, spot returns fluctuated in a relatively tight band between 1970 and 2004, during which time the roll returns were positive. As a result, an allocator with a persistent exposure to commodities via the S&P GSCI Index during those three-plus decades would have benefitted from price increases in both the underlying commodities and from rolling futures contracts in backwardation. Second, the period since 2004 has been characterized by higher spot return volatility and negative average roll return (about -10 percent from 2004 to 2017).
How can an allocator respond to negative roll returns?
An obvious question is why roll returns remain persistently negative. Unfortunately, some of the obvious answers seem incomplete. For example, Mou (2011) posits that GSCI’s published roll-rules allow arbitragers to front-run the index. That argument may be true at some level—publicly declaring when and how much to trade seems like a suboptimal approach—but a simple arbitrage strategy that persists for more than a decade strains even weak formulations of the efficient market hypothesis.
Perhaps a more important question than why roll returns have been so negative for the past decade is what an asset allocator who wants persistent exposure to commodities can do about it. One option is to pay the roll return “tax” and accept that as the cost of holding commodity exposure. Another option is to buy and store physical commodities. A third option is to develop execution strategies that look like a dynamic game—i.e., optimize a function that outputs a roll date and volume for each commodity, based on expected transaction costs. Transaction costs usually vary as a function of future spreads, volume, volatility, and other variables, making this dynamic game an uncertain one. This last option is not easy to implement, but it could lend itself to data analysis and systematic strategies.
Glossary³
S&P GSCI Total Return Index: measures the returns accrued from investing in fully-collateralized nearby commodity futures.
S&P GSCI Excess Return Index: measures the returns accrued from investing in uncollateralized nearby commodity futures.
S&P GSCI Spot Return Index: measures the level of nearby commodity prices.
Backwardation: the condition in futures markets wherein the price of a commodities’ futures contract is trading below the expected spot price at contract maturity. This also refers to a downward-sloping term structure of futures contracts.
Contango: the condition in futures markets wherein the price of a commodities’ futures contract is trading above the expected spot price at contract maturity. This also refers to an upward-sloping term structure of futures contracts.
Roll return: represents the net benefit or cost of owning the underlying asset beyond moves in the spot price itself (CME Group, 2014).