
Is historically low volatility in U.S. stocks a sign of investor confidence or complacency? With the CBOE Volatility Index (VIX) recently hitting an all-time low, and pairwise correlations among U.S. shares similarly subdued, the answer remains elusive. Regardless, markets may not be pricing in the risk of a broad, systemic shock to the U.S. equity market. It is worth remembering, however, that both volatility and correlations have a history of suddenly spiking higher.
The current low-volatility environment
The VIX fell to a 23-year low on June 9, 2017 (Chart 1), accelerating a year-long downtrend that has accompanied the S&P 500 Index’s steady climb. The recent performance of the VIX may suggest that investors seem to have mostly cast aside their fears, remaining undaunted even in the face of an aging bull market and increasing valuations (e.g., PE ratios).
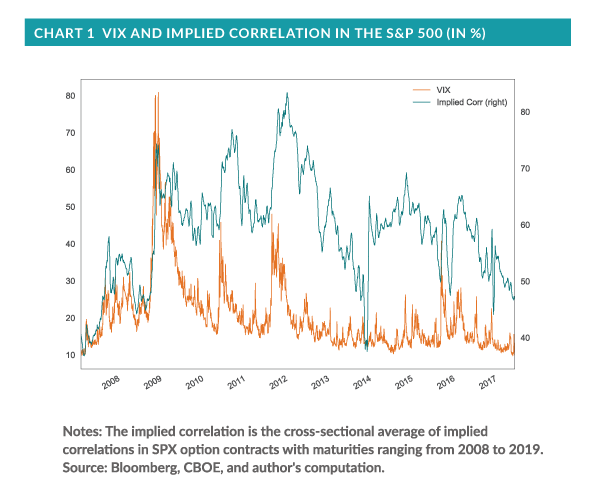
It is possible to try to make general inferences as to why the VIX has been falling so precipitously, but pinpointing exact causes is difficult. One measure offers important context, however. The average 30-day implied pairwise correlation of stocks in the S&P 500 (Chart 1- right y-axis) has also been falling since 2012, a downtrend that has only grown more pronounced over the past year.
Low pairwise correlations in a low-volatility market environment may suggest that investors expect low volatility in the short term and/or that any market shocks will have a low probability of becoming systemic. In other words, investors may believe that the biggest near-term risk they face is a shock that affects only a discrete slice of the S&P 500, a risk that can theoretically be mitigated through diversification.
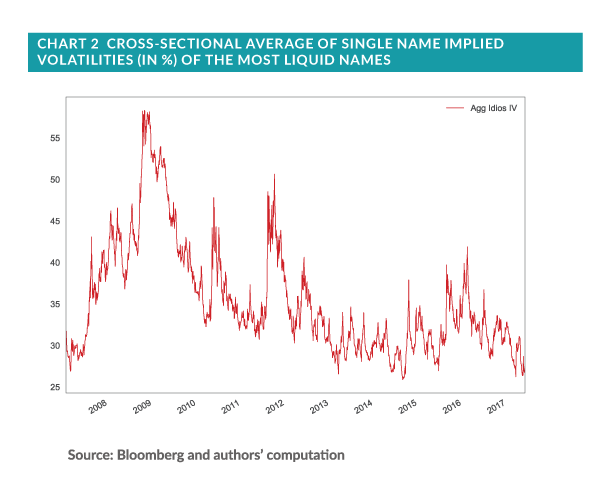
Additionally, individual stocks have become, on average, less volatile since the 2008 financial crisis, and especially so over the past year. Chart 2 plots the aggregate cross-sectional volatility for more than 1000 of the most liquid (based on trading volume) U.S.-listed equities. Once again, the data may imply that investors have adopted an increasingly sanguine outlook. A negative reaction to any approaching shock, investors seem to believe, will likely manifest meaningfully in only a narrow subset of the overall market.
Low-volatility and the potential for sudden changes
Whether historically low VIX levels, pairwise correlations, and idiosyncratic volatilities should reassure investors or militate greater caution depends on one’s perspective. Optimistically, markets could accurately be signaling a continuing period of relatively low—or at least contained—risk, generally an environment conducive to the beneficial effects of diversification that offer potentially greater rewards for skilled stock-pickers.
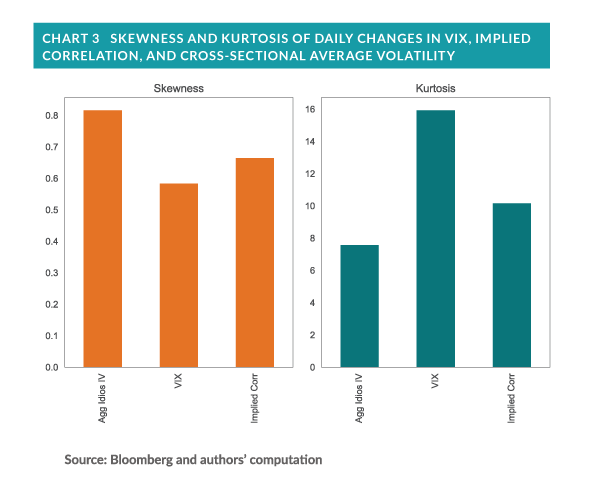
The alternative view is potentially more troubling. The data may indicate that markets underestimate the probability of a systemic shock. All two of the charts above show a tendency, since the 2008 financial crisis, for periods of falling volatility (or correlation, as the case may be) to precede sudden, sharp spikes higher. All three series exhibit relatively high skew and kurtosis (Chart 3).
Potential implications
While none of these measures speak directly to the timing of sudden moves in either direction, investors should remain cognizant of the historical tendency for rapid, positive shifts to occur. When they do, diversification may not prove as effective as expected, with 2008 being an extreme example of this phenomenon.
Are investors right to be so sanguine about near-term market risks, or are they being complacent? Only time will tell which interpretation is correct, but it is unclear whether investors’ portfolios are ready for the latter scenario, should it come to pass.