
In the first post of this series, we announced the release of a standardized dataset of 911 calls from five US cities as part of a collaboration with the Vera Institute of Justice. This piece will dive deeper into how and why this dataset was created. Out of all the variables that the dataset contains, the three that are perhaps the most interesting from an analytical perspective are:
- Call for Action (CFA) code: The reason for the call.
- Disposition: The ultimate outcome of the call from an enforcement activity standpoint.
- Call Type: Whether the call initiated from a 911 call, a police officer, or otherwise.
Combined, these three variables help us understand the patterns of incidents, and allow us to compare and contrast how 911 calls play out across and between different US cities.
As noted in the first post, much work needed to be done to standardize columns both across cities and between years within the same city. For each variable, we had to establish a common, consistent, and meaningful taxonomy. Creating such a taxonomy required making decisions about what was important, what details to leave in, and what to consolidate. In this blog post, we will discuss some of those design decisions and how they help us better understand 911 data.
Why Is Creating a Shared Taxonomy Needed?
While each of the variables we wanted to include in our final dataset represented concepts that are easy to grasp, the way they are represented in the 911 data is far from homogeneous — not surprisingly, as this data comes from an operational system designed to route officers to incidents and to support them while they investigate a call. Within this system, fields are not designed to facilitate data analysis, but rather, to ensure that information is accessible to the responding unit. This is a common issue for a lot of open data, and in most cases, it’s necessary to address multiple challenges to get the data into an analyzable form. In fact, the central reason for open-sourcing this dataset and the associated code is to save others from having to duplicate our efforts in the future.
The selection of specific variables to focus on was driven by the research interests of Vera, as well as different questions we hoped to ask of the data. However, despite careful cleaning, some of these questions were intractable as a result of poor data quality and lack of completeness. In this report, we seek to understand both the particularities of 911 calls and police response within a given city as well as broader trends across the United States. The following list reflects a few of the specific questions we had in mind that informed our decision-making process while creating this dataset:
- Are police-initiated (aka self-initiated) calls more likely to conclude in enforcement activity? Are they more likely to be related to certain types of incidents?
- How often are 911 calls initially misclassified, and are certain categories more prone to misclassification than others?
- Are calls with certain CFAs more prone to conclude with an enforcement activity? Do we see patterns of CFAs that appear better suited to the scope of other city services, such as 311?
First Steps: Standardizing Data Structure
Before we could dig into each of the variables of interest, we needed to address the overall structure of the data. This consisted of two steps. First, we needed to manually identify what data was available in each city, and second, we needed to determine which columns within each dataset mapped to our variables of interest:
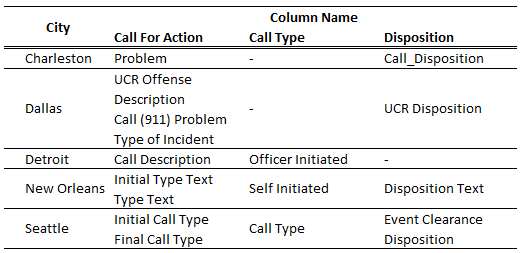
A few features that are important to note:
- Despite selecting cities with detailed 911 call records, not all data was available for all our target cities. Charleston and Dallas were missing a field identifying the type of call recorded, and Detroit did not have a field describing the outcome of the entry. While this would limit the questions we could investigate in these cities, we felt that each dataset still contained enough information to be included.
- Conversely, some cities had more than one field pertaining to the CFA code associated with a call. Both New Orleans and Seattle included both the CFA code initially assigned to a call as well as the code eventually associated to a given incident (e.g., the initial CFA code might be “Suspicious activity,” while the final CFA code could be reassigned to “Burglary”). Dallas provided even finer granularity.
Applying these mappings, we then moved from having multiple different files for each target city to a single data file. As we will demonstrate, this step — although necessary — was not sufficient to prepare the data for analysis.
Defining a Common Taxonomy
After mapping columns of interest to a common name, we then needed to standardize the entries within each column. This posed an even larger challenge, given that each column included a wide variety of categories. The CFA code alone had 2,683 unique entries! It’s hard to imagine this many distinct call types warranting their own category, so what was going on? Let’s take a look at some of those entries:
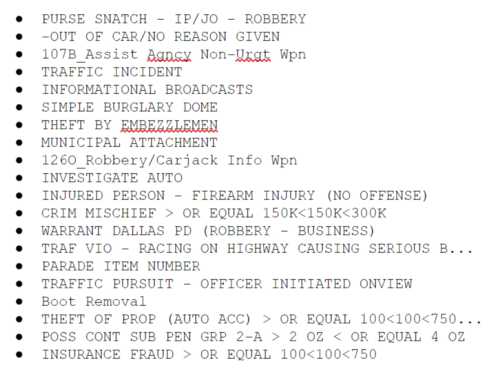
In many cases, the issue is one of incorrect data entry; for example, “THEFT BY EMBEZZLEMEN” should probably be “THEFT BY EMBEZZLEMENT.” Other times, the description might simply be too granular for our needs, like the case of “CRIM MISCHIEF > OR EQUAL 150K<150K<300K.” In addition, while some of the entries are easily graspable concepts, others require domain knowledge to better understand what type of incident they represent. Let’s now take a look at each of the columns in turn and try to tame these categories into a taxonomy that makes more sense.
1. CFA Codes
CFA codes are perhaps the most important variable in the dataset. Each city we analyzed had its own unique nomenclature for call types. These descriptive fields were often free-form, leaving it at the discretion of the 911 operator to decide the most relevant information to record. Other cities seemed to have more structure to the call types, but even in those cases, we found too many categories and needed to collapse entries. New Orleans and Seattle had on the order of 200 unique CFA options. For others like Dallas, the number was closer to 1,000.
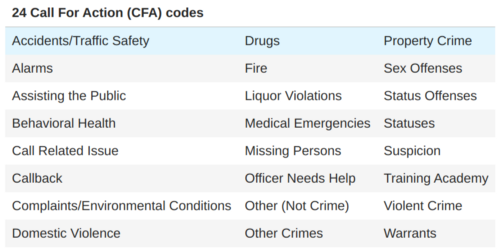
In order to facilitate cross-city data comparisons, we assigned every code to one of 24 broader categories derived from research Vera had conducted in Tucson, Arizona and Camden, New Jersey:
With these 24 categories in hand, we manually went through each unique call type and assigned it to the most appropriate category. It is important to note that some of these classification decisions ended up being rather subjective. In the interest of transparency, we are including a full list of these mappings, which you can view on our Github repo. We have done our best to interpret each call type according to this taxonomy and are providing the code to enable users to define their own mappings. Once we apply these mappings, we can explore the call breakdown for each city:
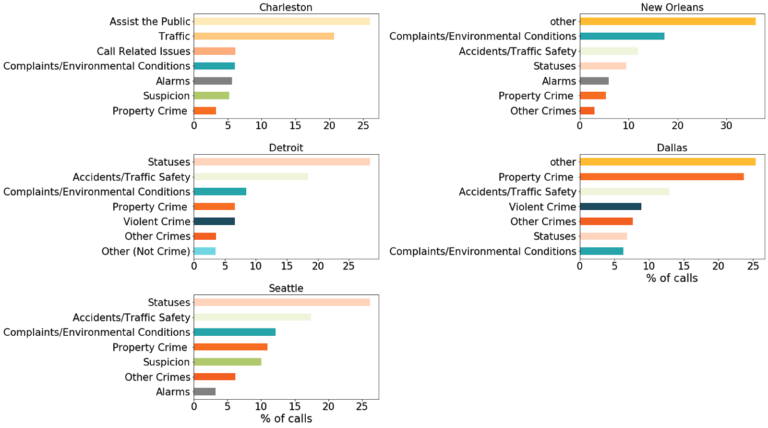
Looking at the distribution of the top seven most common call categories in each of the cities considered, we find intrinsic differences between them. For Charleston and Detroit, a large number of calls are unclassified; it is unclear if these are manual entry errors or relate to departmental protocols within the respective systems. In Dallas, “Property Crime” is the most common CFA code. However, in all cities, traffic violations rank among the top three reasons for dialing 911.
It is worth noting that this hierarchy has been computed using all of the data available for the cities under consideration and does not capture any drift that might have happened over time. This might be an issue if, for example, the guidelines on how to record specific calls changed over time.
Recommendations for CFA Codes
While it may be useful for some municipalities to preserve the ability for 911 operators to enter free-form text regarding a call, particularly if procedures are in place to use these records to analyze certain incidents after their resolution, supplying the operator with a separate field containing a drop-down list of options to use when classifying the CFA related to the call would facilitate big-picture analysis for a large volume of information within and across cities. It is encouraging that efforts to standardize 911 call-intake, such as the Criteria Based Dispatch (CBD) approach, are being implemented. These standardizations are focused on unifying question asking procedures, which in turn reduce variation in CFA codes classification by limiting the options.
We make no claim that the classification system used in this study is optimal for all use cases, as law enforcement officials have a better domain knowledge to identify and standardize a taxonomy. However, we do believe that employing hundreds of unique identifiers in classifying calls is seldom useful for any meaningful statistical analysis.
2. Disposition
Similar to the case of CFA codes, each city we investigated had their own taxonomy for identifying the disposition of a particular call. Luckily, the number of unique entries was slightly more manageable. Dallas had 12 unique identifiers, New Orleans and Seattle between 22 and 25, while Charleston had more than 300.
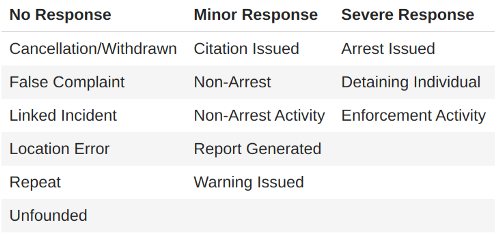
In order to standardize the responses, following Vera’s guidance, we assigned each disposition code to one of 14 possible actions (see Table 3). After mapping the raw disposition codes available in the data to this classification system, we found substantial differences between cities: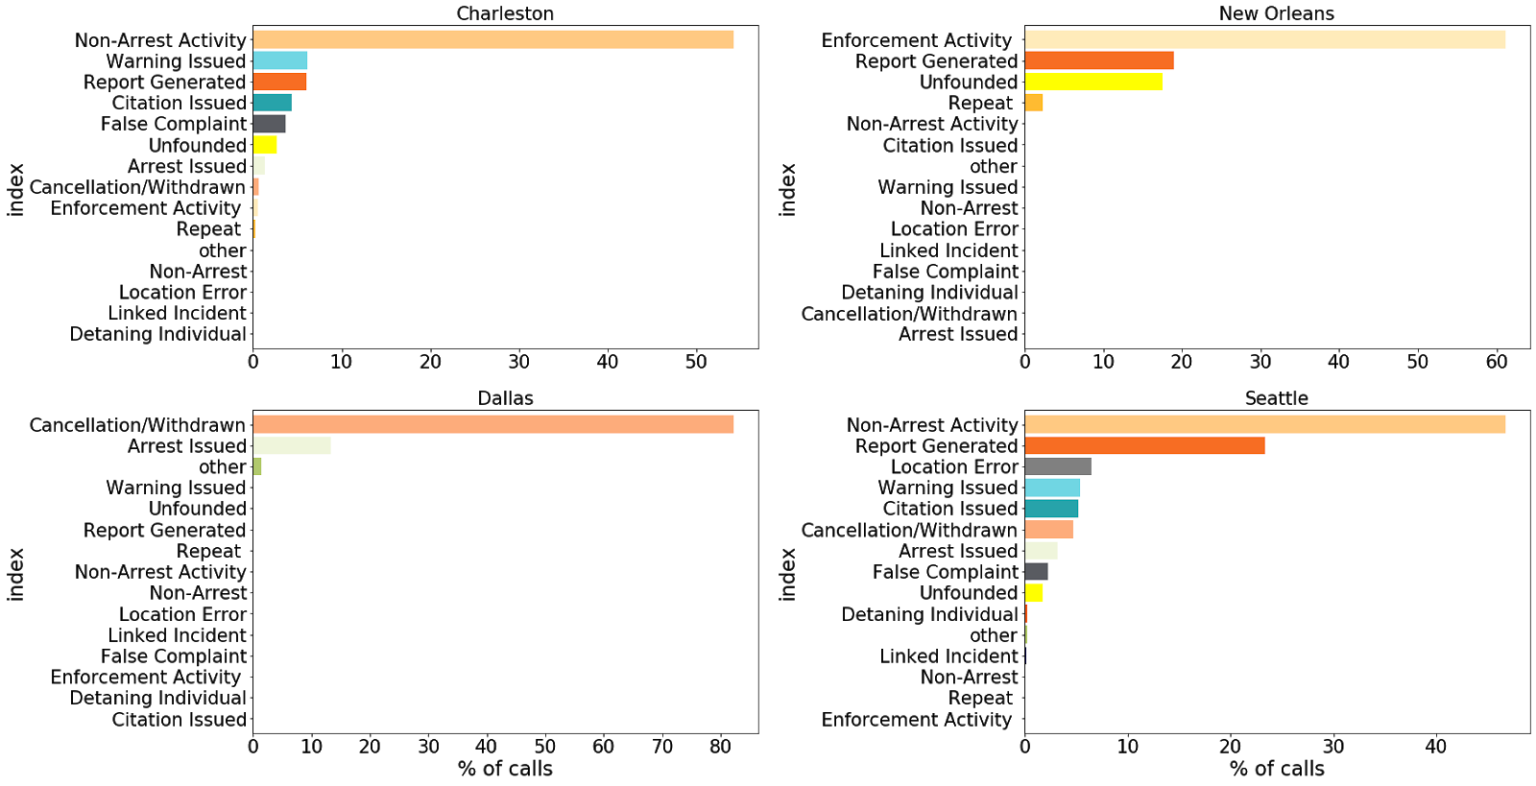
This divergence may be due to the differences in the incidents a community is experiencing, or to the peculiarities of the data-collection process. Below, we have outlined several interesting insights:
- Dallas used 12 different potential codes referring to the outcome of a call. 80% of the calls were classified as “Suspended,” which mapped to “Cancellation/ Withdrawn” according to our taxonomy. Another 18% of calls, comprising six other codes, were mapped to “Arrest Issued.” We believe this to be a limitation of the data rather than representing a unique feature of the Dallas community in so far as calls identified as prompting a minor response or none at all were all classified together as “Suspended.”
- Similarly, on the opposite side of the spectrum, 60% of the entries for New Orleans were classified as “Necessary Action Taken,” which we mapped to “Enforcement Activity.” However, in truth, these could correspond to any minor or severe response categories.
- Charleston was the only city that provided a very fine granularity in the disposition information regarding the calls. The challenge in that case was mapping the more than 300 codes available to the 14 categories we were targeting. Due to missing information and the fact that Charleston used particular codified names for some dispositions, we were unable to map approximately 50% of the disposition descriptions, corresponding to about 20% of the total call volume, to any of the categories above. Furthermore, over 10% of the disposition codes used (55% of the total call volume) corresponded to “Patrol Area” and “Advice Given,” which we broadly classified as “Non-Arrest Activity.”
Using the disposition information, we wanted to explore the relationship between the severity of the action taken and other characteristics of the call — for example, whether the call was initiated by a police officer or an individual, or the specific reason for a call.
In order to do so, we needed to assign each of the 14 dispositions in the data a rating to indicate whether the resolution entailed no response, a minor response, or a severe response as outlined in Table 3.
Due to the peculiarities discussed above regarding disposition entries, the distributions we found for each city were markedly different. About 80% of the calls in Seattle and Charleston necessitated a minor response, while 80% of the calls in Dallas generated no response whatsoever. Lastly, 60% of the calls in New Orleans appeared to require a severe response.
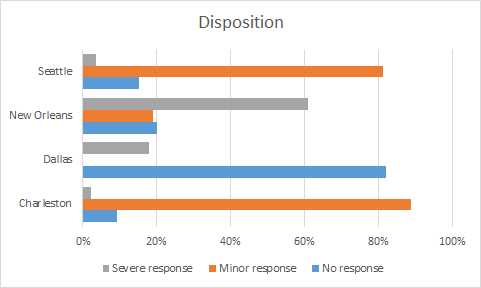
Keeping in mind the challenges we faced in interpreting the meaning of the individual disposition codes used by each city, we believe that differences are likely due to an imprecise mapping of the disposition data to the response level needed to resolve the call.
Recommendations for Disposition
In order to draw more meaningful conclusions from analyzing call dispositions, we have identified a strong need for clearer, more specific annotations in the data for all cities. As with the Call for Action entries, we would recommend requiring operators to select from a drop-down menu of choices containing standardized disposition options in addition to the free-form text each municipality might elect to record.
3. Call Type
One final characteristic of the data that we wanted to analyze was whether the call was initiated by a police officer or from a different source. We have used the terminology “self-initiated” to refer to intervention initiated by a law enforcement officer, distinguishing these entries from the “non-self-initiated” calls that were produced otherwise (e.g., by a civilian dialing 911, an alarm system going off, etc.). Of the five cities we analyzed, four had an entry identifying whether the call was self-initiated.
While the name of the field was different for each city, and some cities (e.g., Seattle) chose to provide even finer granularity (e.g., 911 call vs. alarm vs. in-person complaint), they all clearly made this binary distinction. In turn, we are more confident that the conclusions drawn using this field are more likely to be indicative of the unique characteristics of these communities as opposed to classification issues.
Among the cities publishing the source of the call, we identified differences in the percent of calls initiated by law enforcement as compared to the general public.
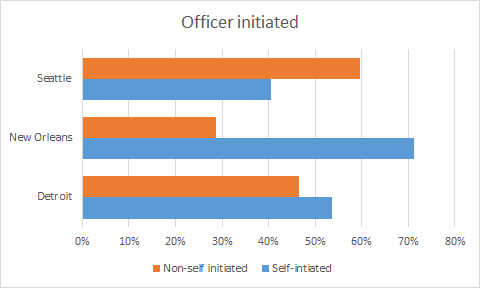
The vast majority (over 70%) of New Orleans calls were officer-initiated as compared to Seattle where almost 60% of the entries non-self-initiated. Detroit was situated somewhere in the middle, having a roughly equal proportion of the entries as self-initiated versus not.
Remaining Challenges and Recommendations
Having mapped each of the variables to a common taxonomy, we can also explore how they relate to each other and whether these relationships vary between cities. As we mentioned above, the challenge of collapsing entries into meaningful categories without being experts in this domain is challenging, and thus, these analyses should be considered exploratory. While we are confident that the consolidated dataset is more useful for broader analysis than the raw data obtained from each city’s open data portal, we must be careful to disclose limitations inherent in this process.
The first issue involves domain knowledge. While we did our best to understand each of the approximately 2,000 call codes, it is quite possible we made errors stemming from a lack of understanding of what certain codes mean. While these might be obvious to someone working in a dispatch center or for an officer on the street, the average person using open data will likely struggle to identify their meaning.
To address these concerns, we recommend that police departments implement the following changes to their data-collection practices:
- Wherever possible and without impeding the operation of the 911 call system, CFA codes, disposition categories, and self-initiated categories should be entered from a standardized, possibly hierarchical, list of options. See the NIBRS coding approach for crime reporting as an example.
- When situations arise where these categories are not sufficient, a clear centralized procedure should be implemented for adding them to the hierarchical list of options.
- Each category should have a corresponding entry in a data dictionary describing when that option was created, what it refers to, and any specific caveats that a user might need to be aware of when using that category.
- Periodically, the hierarchy of options should be revisited and similar entries merged to maintain an efficient categorization of calls.
In addition to these category recommendations, we would suggest that each city include both the initial and final call type in their summary, and indicate who assigned the call type and disposition type: the reporting officer, the person receiving the 911 call, or another party.
It should be mentioned that even with a more efficient data-collection process, the possibility that variable classification will differ across departments, people, and locations remains. CFA codes capture a single classification — call-takers must decipher what they feel is the most important or best fit for the given situation. This decision point is also highly impacted by departmental priorities and knowledge; classification of the same event may differ across departments. Unfortunately, it is hard to know the extent of this variation, particularly as it pertains to CFA codes. Further research that combines an examination of classification variables such as CFA with that of existing free-text narrative fields is needed to better understand this concern.
The second limitation is a technical concern: how do you examine over 2,000 unique entries and easily map them to 24 categories? For this work, we spent a lot of time collaboratively editing a large spreadsheet to create the required mappings. This was a time-consuming, error-prone, and inefficient process. As a result of this work, we were inspired to create an open-source tool, smooshr, which aims to make this process much easier and more dynamic. Smooshr is designed to quickly generate taxonomies and column mappings both within and between datasets for easier analysis. If you find yourself having to consolidate a myriad of entities for your own datasets, we invite you to give smooshr a try.
In conclusion, we now have a consolidated 911 calls dataset with common column names and a condensed taxonomy for each city. You can check out the consolidated dataset as well as the scripts used to produce it on our GitHub repo. Although this enabled some exploratory analysis regarding policing practices across different locations, we remain unable to investigate geographical or temporal variations within a city without further cleaning.
In the final post in this series, we will discuss the standardization of geospatial and temporal data in each city. Such standardization will enable us to both map important variations within cities, and to join the data to socio-demographic variables from the US Census American Community Survey, adding context and allowing us to ask more interesting questions. Stay tuned.