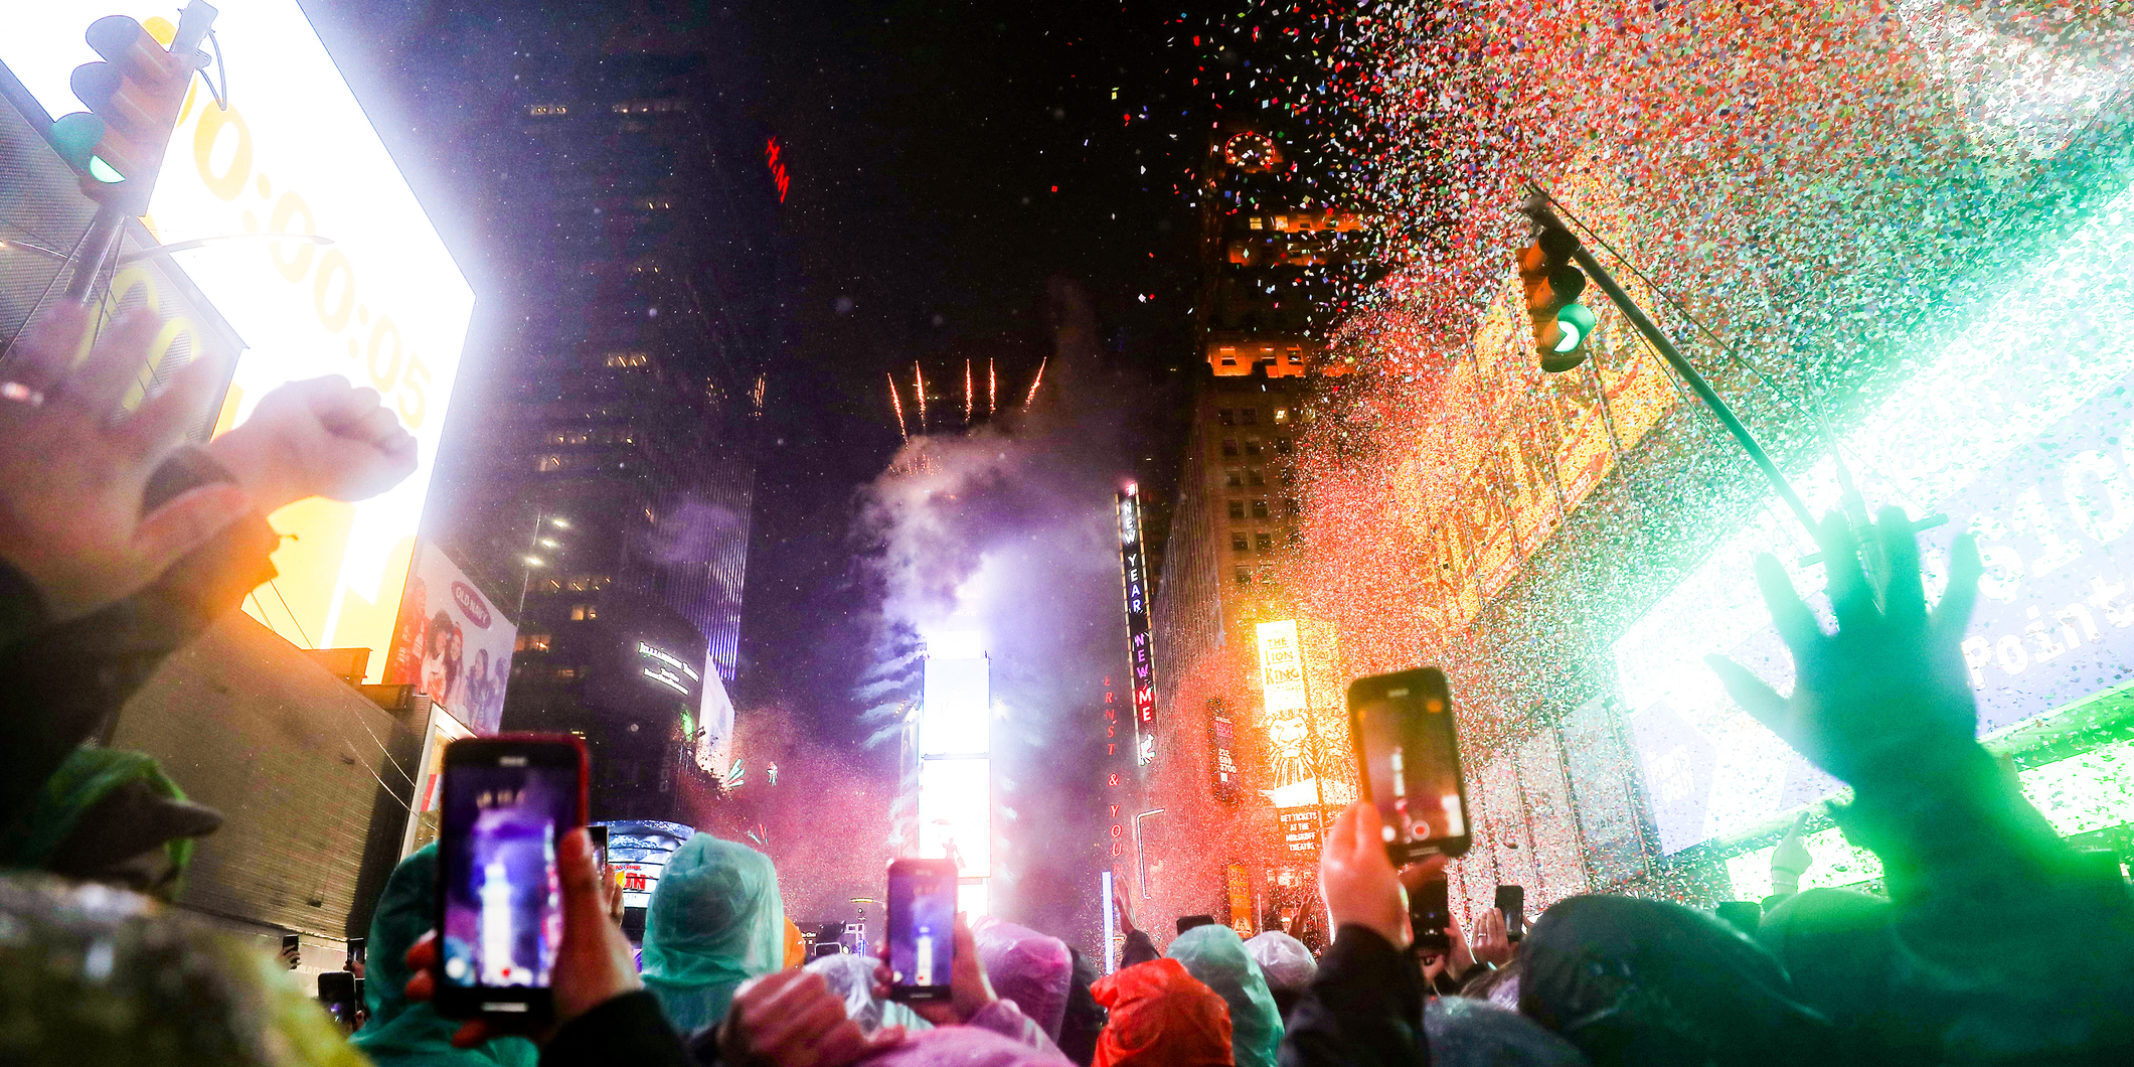
New York City knows how to throw a party, especially when people have a few days off! As we settle into fall, we found ourselves reminiscing about summer with its BBQs, rooftop parties, street parties, and spectacular fireworks on the 4th of July. It got us thinking, what holiday does New York City celebrate the most? We decided to see if open data could help us answer that question.
Our metric for the largest party is going to be loudest — how many noise complaints the city receives. New York City’s 311 service is the main channel that people can use to complain about noise, rats, garbage, or just about anything else. These requests or complaints are all made available on the New York City Open Data Portal, and with over 2.5 million 311 requests last year alone, boy do New Yorkers like to complain.
311 entries have two columns that help describe the nature of the complaint: Complaint Type and Descriptor. We can get a feel for the variety of complaint types by looking at the unique entries for each. As the red bars below indicate, a fair number correspond to noise complaints.
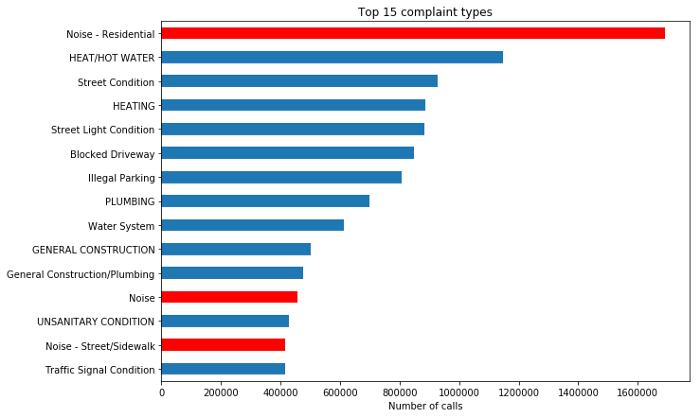
Digging a little deeper, though, we see that not all of these are relevant to our quest for the most complained-about, and therefore potentially the most party-filled, holiday. For example, we probably don’t want to include calls about construction or ice cream trucks in our analysis.
To filter out just the call types we are interested in, we select entries that have a Complaint Type of one of the following:
- Noise — Residential
- Noise Survey
- Noise — Park
- Noise — Street/Sidewalk
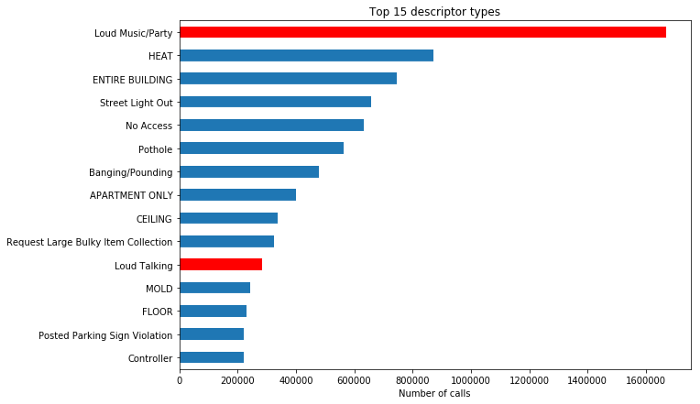
We will also include calls that have a Descriptor Type corresponding to the following:
- Car/Truck Music
- Car/Truck Horn
- Loud Music/Party
- Loud Talking
Applying that filtering still leaves us with 2,573,188 calls over the past nine years. The first way we might think about answering our question is to simply look at the median number of calls that occur on each holiday aggregated by year. If we do this, we get the following:
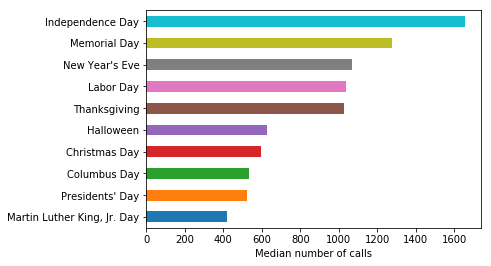
At first glance, it looks like the 4th of July is the most complained-about, quickly followed by Memorial Day and Labor Day. Here at Two Sigma, though, we are all about time series, so let’s expand this analysis to take a closer look at how many complaints there are per day over the past 10 years. We will also mark the 4th of July as a red reference line for each year.
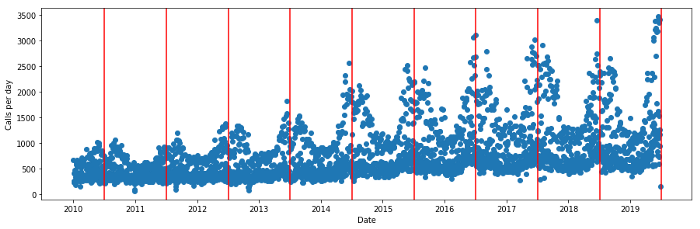
The situation appears a bit more complex than we originally suspected. We can see that there are some clear seasonal trends for noise complaints, with the summer months typically drawing more 311 complaints than winter months. We can also see that the total number of calls increased pretty sharply between 2010 and 2015, then leveled out a bit. This could be an artifact of more disturbances, but also potentially from changing trends in the use of 311 service overall.
If we dig in deeper by color coding the points by weekday (blue) and weekend (green), there appear to be multiple patterns superimposed on top of each other:
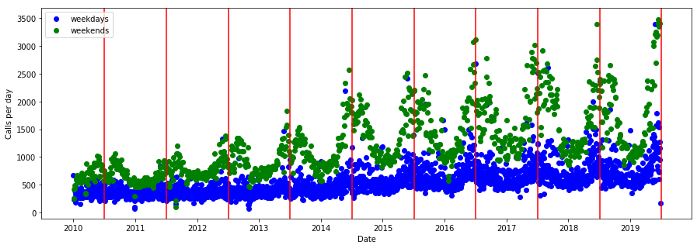
It’s pretty apparent that weekends and weekdays are pretty different in terms of call volume. This makes intuitive sense, as we’d probably expect more noisy activity on the weekend.
Finally, let’s take a look at how the average number of calls varies hourly over each day of the week.
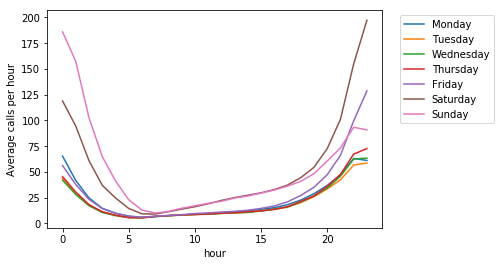
It looks like most complaints happen in the evening and early hours of a day, with the start of Sunday morning being particularly bad. This makes sense, but is not necessarily the way we would naturally think of describing calls. For example, if you placed a noise complaint at 1am on the 5th of July, you would more naturally think about that disturbance happening as part of the 4th of July celebrations. To try and capture this, we can shift each complaint time by five hours, which results in a daily profile that ends up looking like the following:
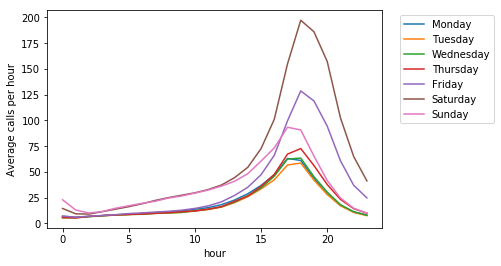
This slight change brings the data more into line with our intuitions of what indicates the end of one day and the beginning of another. To quickly recap what we have learned about our data, the call volume seems to vary in three main ways:
- An overall trend that increases year over year.
- A weekly cycle, with the weekends having substantially more complaints than weekdays.
- A seasonal cycle that sees more calls in the summer compared to the winter.
These apparent trends make answering our question of which holiday is the loudest much trickier. For example, in calculating the complaint rates for the 4th of July, how do we determine how much of the call volume is due to the holiday itself versus the fact that it occurs in summer? How do we compare different years when the 4th of July happens to land on a weekend one year and a weekday the next?
To answer these questions, we can’t just take the data at face value; we need to build a model that we can use to interpret the data and control for these trends.
To do this, we are going to use a pretty handy open source package from Facebook called Prophet. This library, available for python and R, uses an additive model to attempt to fit a time series such as ours and decompose it into its various components. The basic model has the following components:
![]()
- g(t) is the overall trend of call volume.
- s(t) is the seasonal component, which can in turn be broken out into weekly and yearly cycles.
- h(t) is the effect of individual holidays and what we are really interested in! Once the overall growth and seasonal cycles are controlled for, this will give us the actual effect of individual holidays.
If we look closely at the data, one thing we notice is that it’s not just the mean of the data that seems to increase with time, but also the spread of the data around that mean. It’s actually quite hard for an additive model to capture this kind of behavior because we are simply adding a fixed linear term for each model component to the trend. So if our model gives us a factor +20 for Saturdays, we get the trend g(t) + 20 calls regardless of what year that Saturday happens to be in. Instead, we can use a multiplicative model where each factor is multiplied together with the trend instead of added. The equation for the model then becomes:
![]()
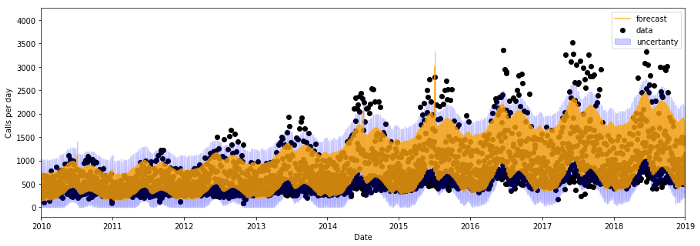
We won’t go into the full details of the model here, but I encourage you to check out the paper on Prophet. Using the Prophet python package we can pretty easily fit the model to our time series data and take a look at the results. The yellow lines in the output below show the fit or trend, the blue the uncertainty in that fit, and finally the data is shown as black dots. As is the case for most base models, there is room for improvement, but it looks like the model does pretty well for our precursory analysis.
The best thing about our new model is that we can now start to look at how different components contribute to these trends to determine what they tell us about 311 noise complaints. The following plots show the contribution to the total number of calls from:
- The overall trend.
- Each holiday.
- Weekdays.
- Day of the year.
The impact of a given component is with respect to the overall trend and can be negative or positive. If negative, for example on weekdays, the model is telling us that there are 200 fewer calls on weekdays compared to an average day. In addition to measuring the effect of each factor, we can also quantify the uncertainty in each. The blue bands around each line shows the 80% confidence limits of our data, signifying we are 80% sure that the true value is within that blue region.
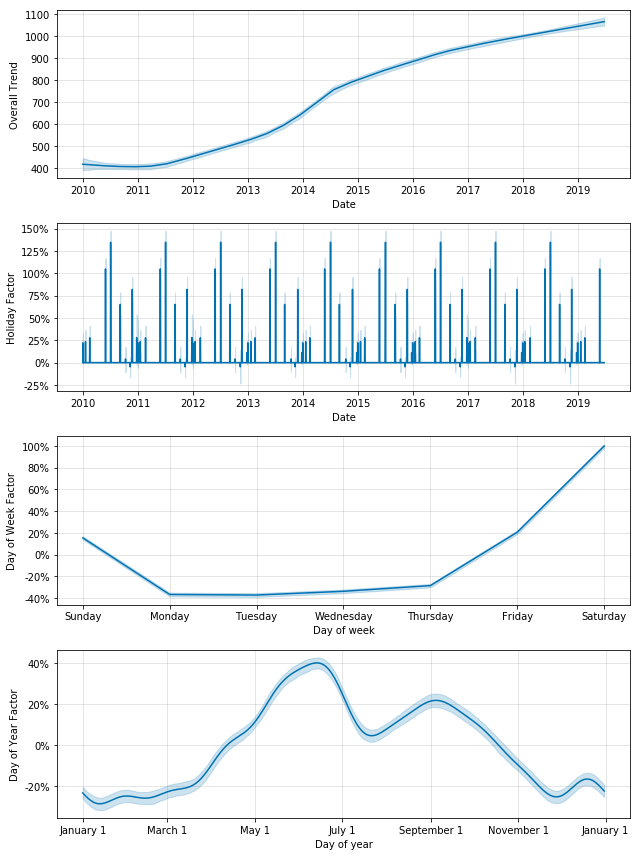
Looking at these plots, our intuition of these trends as explored in the descriptive statistics appears to be supported by the model:
- Fridays and Sundays tend to have about 20% more calls than an average day while Saturday is by far the worst offender with a 100% increase in call volume.
- Winter months tend to have about 20% fewer calls, which ramps up in the summer to vary between 20% and 40% more calls than average.
- The baseline number of calls has risen from around 450 to 1,100 over the past 9 years.
Great, so now that we have controlled for the above mentioned trends, we can now explore the impact of specific holidays on the number of noise complaints by subtracting out the expected number of calls given all the factors we know about and controlled for:
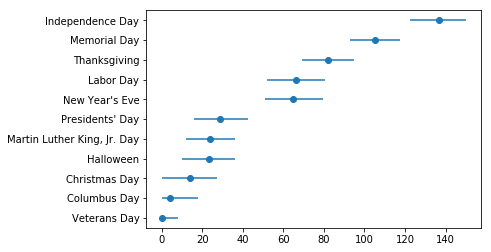
Similar to the earlier graph, the top two offenders are Independence Day and Memorial Day. Interestingly, Thanksgiving has risen in the ranks and now comes in at number three, suggesting that large family gatherings can be, well, noisy? Despite some additional shifts in order, it’s clear that the 4th of July, with its parties and fireworks, remains the most complained about holiday for noise.
Regardless of how noise expectations play into 311 call volumes, this deeper analysis paints a different picture than simply looking at the median number of calls. By using a model to factor in and control for seasonal variations and overall data trends, we get a much clearer view of the independent effect of each holiday.
In summary, we have played around with some interesting open data on 311 complaints and have shown the importance of moving beyond descriptive statistics when working with open data to draw insights. City data is usually complex, with a variety of factors impacting any given measurement. After exploring your data, it’s important to think through how best to account for factors influencing trends so that the feature of interest can be better isolated and measured, typically by building a statistical model.
If you would like to run this analysis yourself or explore other trends in 311 data, check out the Jupyter notebook.