As open data continues to gain prominence in research, the need for accessible and user-friendly tools to search and analyze data becomes increasingly important. Three years ago, we introduced Scout, our open source data discoverability tool, which has since been expanded to explore over 100 open data portals across the world. And now, we’re excited to announce the newest addition to Scout’s features: visualizing your open data.
The New “Visualize” Tab
In the past, Scout only analyzed and surfaced the metadata of a dataset, which included information such as the dataset’s title, keywords, and description. Now, with the addition of the “Visualize” tab, users can now view the actual data included in a dataset.
The “Visualize” tab was one of the most common user requests we received and it is a powerful addition that provides a few different ways to explore a dataset. We currently support three types of visualizations with plans to add more in the near future.
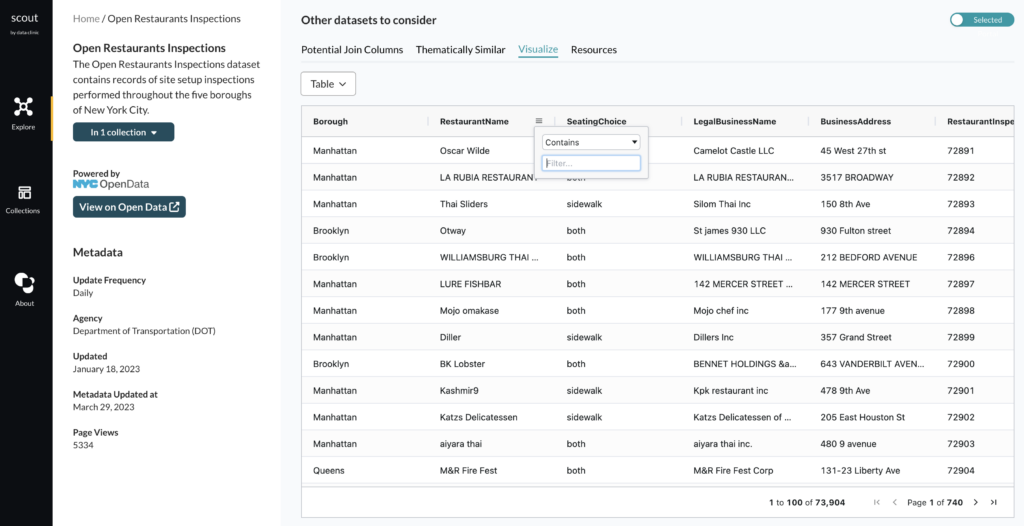
The default view is the “Table” which lets you view every row of data and search and filter it according to your needs.
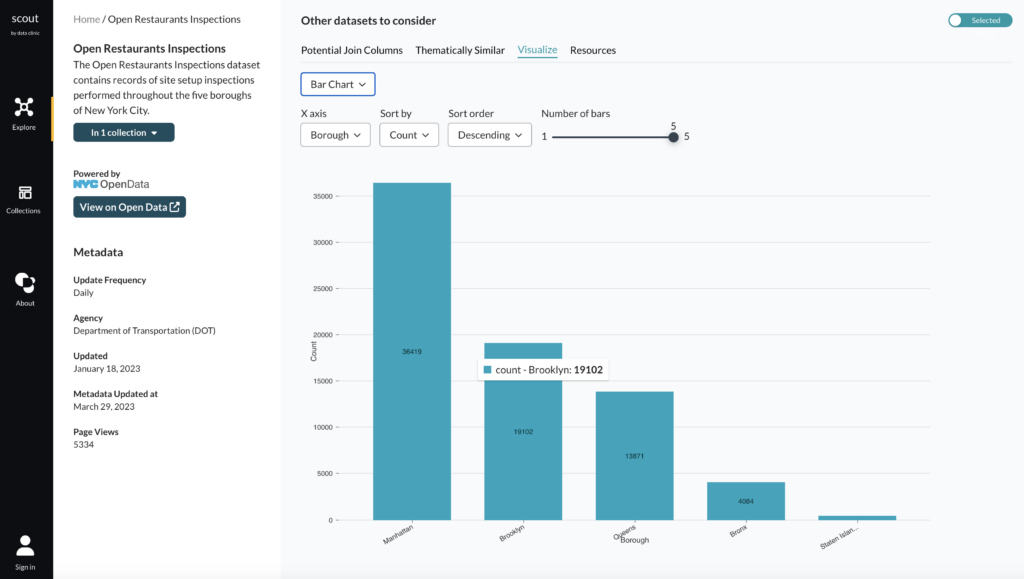
The “Bar Chart” view allows you to aggregate data by different fields and explore the general distribution of the data.
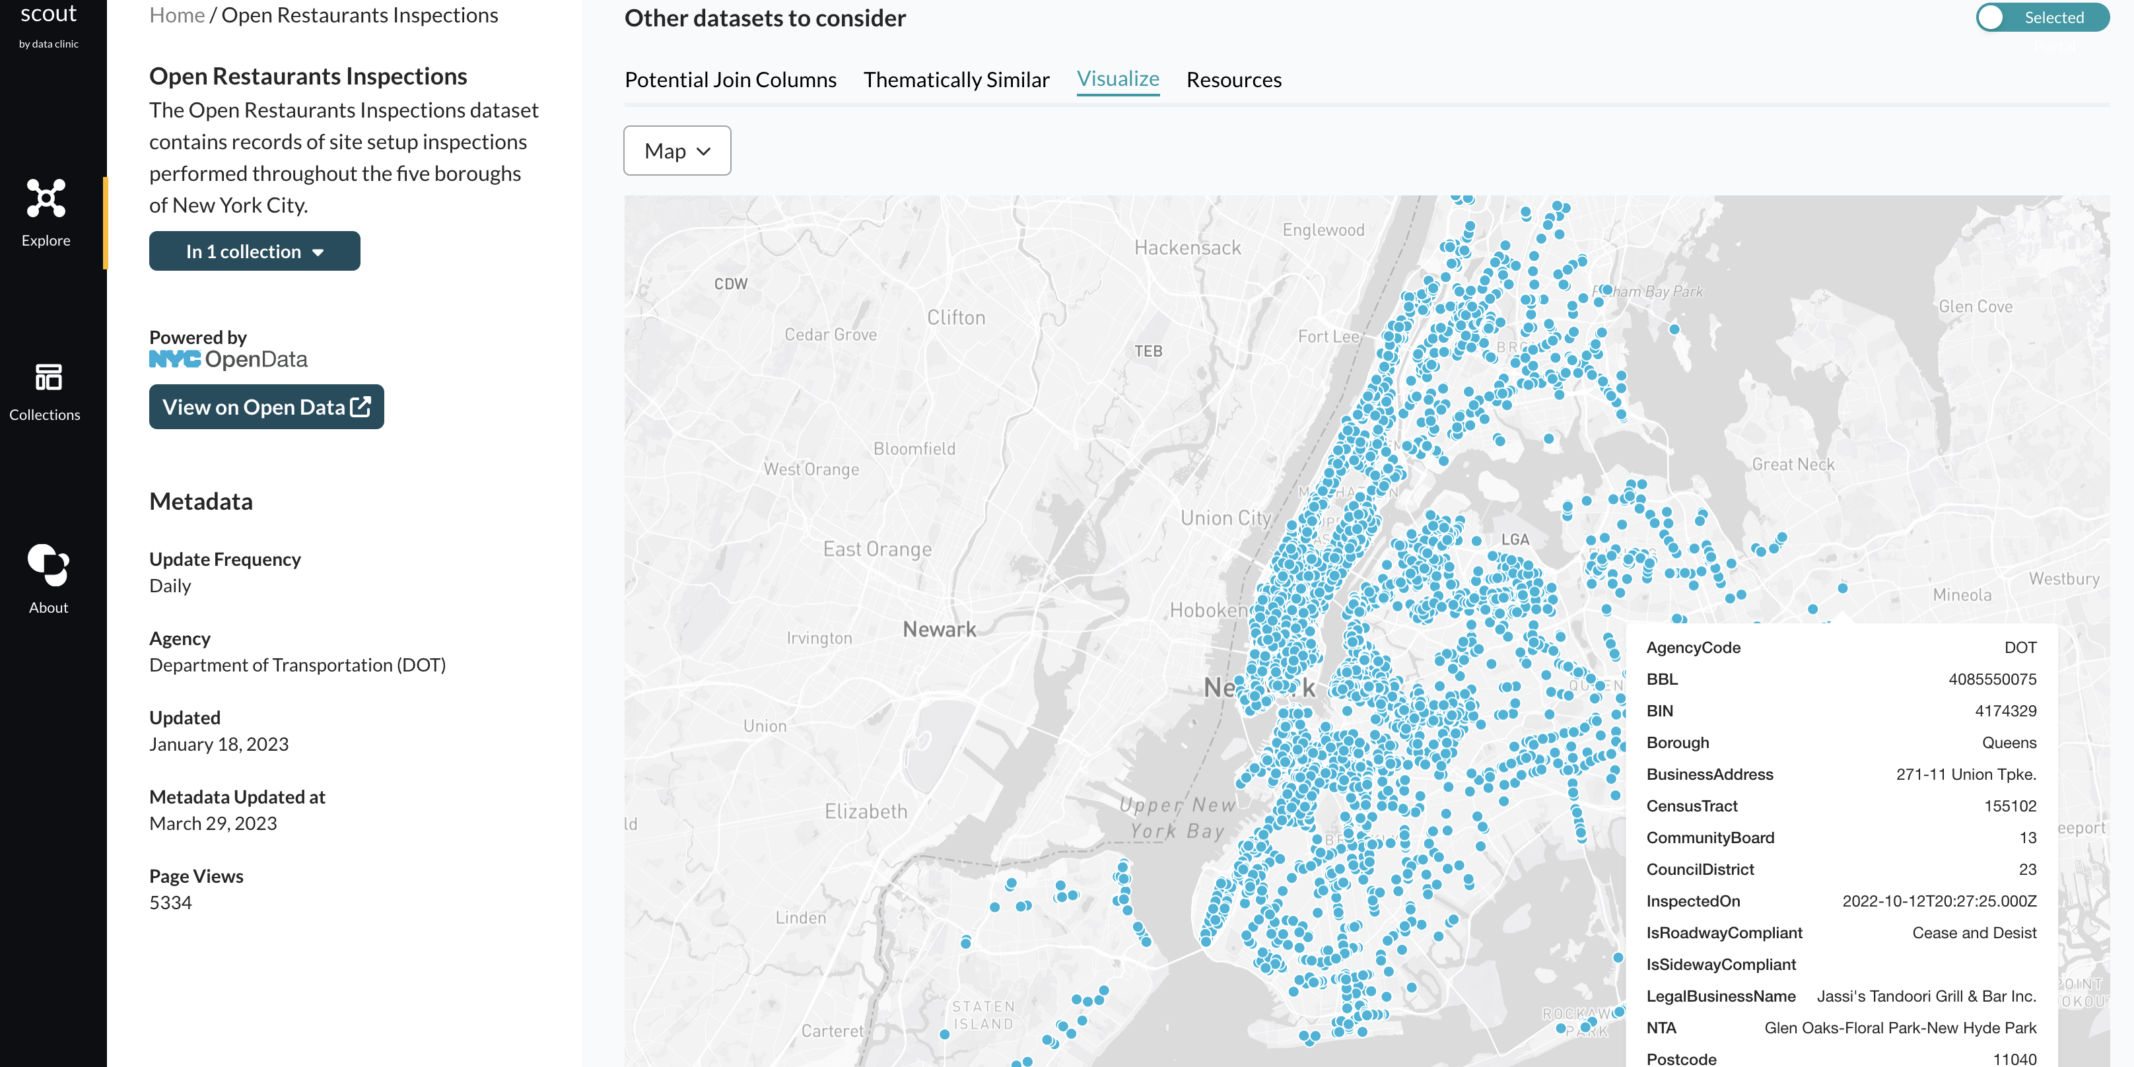
The “Map” view attempts to automatically detect which columns have geospatial data and plots them on a map.
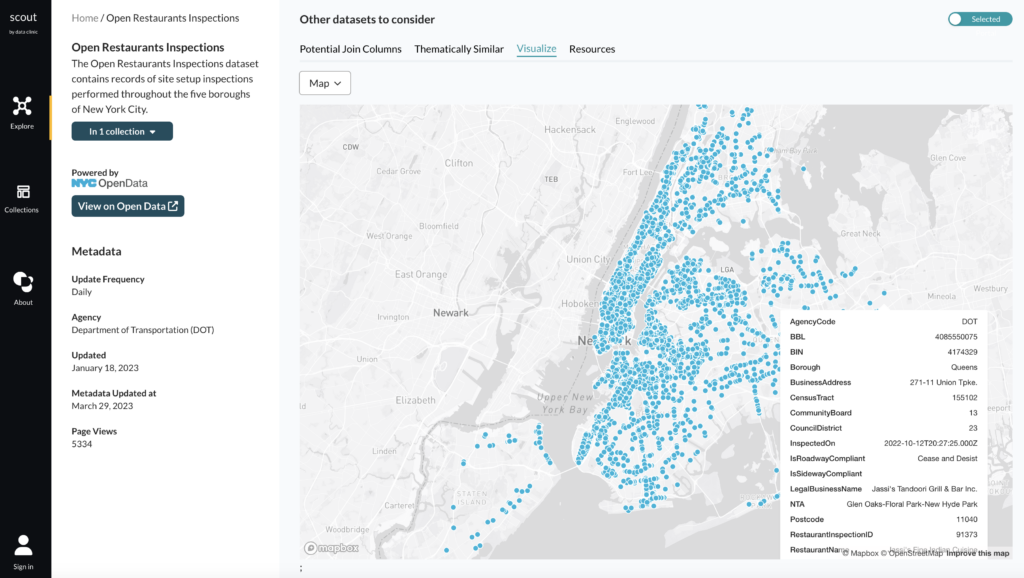
While we still encourage users to download the actual dataset for more advanced analyses, these features are intended to make the initial exploratory data analysis as easy as possible so that users can decide if a dataset is relevant to their research in the first place.
Presenting at New York’s School of Data 2023

On March 18, 2023, we had the opportunity to present Scout’s new features during a workshop at New York’s School of Data. The workshop involved a walkthrough of the tool’s capabilities and gave us a chance to receive feedback from attendees. It was an engaging and informative event that allowed us to understand how Scout can be improved to better serve the open data community.
We received valuable feedback from attendees, which resulted in an influx of GitHub issues that same day, such as a suggestion to improve the detection of latitude and longitude fields for spatial datasets, which we are already working to incorporate into Scout. This close feedback loop between the open data community and Scout allows us to enhance the utility of this application with each GitHub issue that is opened.
Future Plans
We are always looking to improve Scout and make it more user-friendly. Our immediate priorities are to continue expanding the existing visualization capabilities. Some examples include adding new visualizations (such as a scatter plot), adding more ways for users to decide what fields get visualized and aggregated, and allowing users to filter queries for very large datasets.
Scout is an open source product and the code can be found in our GitHub repository. We actively monitor the repository for any contributions from the community, so we encourage you to open a GitHub discussion or issue if you have any feature requests or find any bugs. If you want to contribute directly to the codebase, our repo also contains instructions on how to set up Scout locally. Scout was built for the open data community and we are excited for you to get involved.