
At Two Sigma, we build platforms that allow for conversational research. Metrics are foundational for how we build these platforms successfully; they allow us to prove or falsify our hypotheses, track how user needs are growing and changing, and pivot strategies when needed.
We recently rebuilt one of our metrics systems using open source software as building blocks and learned a few key lessons:
- Requirements should shape the system you build.
- Choose your open source solutions wisely, and use them when you can.
- Often it’s not about writing code. It’s about orchestrating the pieces together with the right configurations.
We’ll walk through the project’s design process as a good exercise in system design, resourcefulness, and creativity, and we hope it will offer useful insights into how to approach the next system you build.
The purpose of the metrics system and our end goal
Metrics give you a window into the state of a system; without metrics, you’re driving blind. Usage metrics, in particular, are important because:
- They let you know how your system is being used and by whom.
- If you know what people want to do, you can often do a better job doing it.
- With the right data, you can model and predict usage and demand increases, helping you plan for the future.
In this example, we have a high-performance data platform that we want to measure usage metrics for:
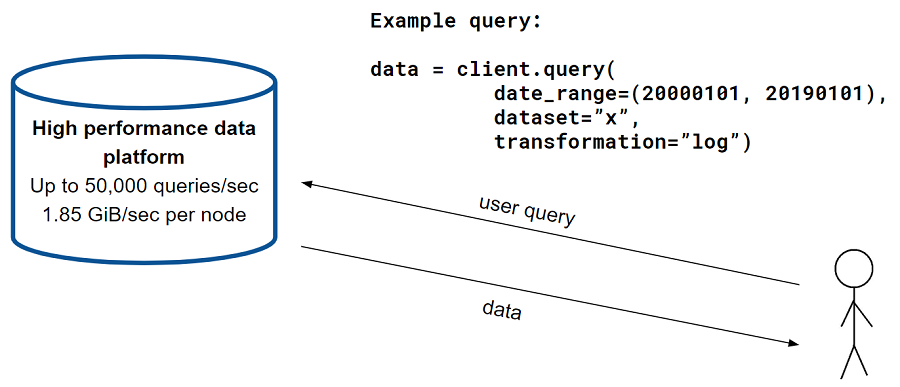
When a user sends a query (e.g., “I want data from dataset x from the year 2000 to 2019, and I’d like to perform some transformation, let’s say a log of all of the values”), the data platform retrieves the appropriate data, performs the relevant computations, and returns the result to the user. We call it a high-performance data platform because it can return up to 50,000 queries per second and 1.85 GiB of data per second, per node.
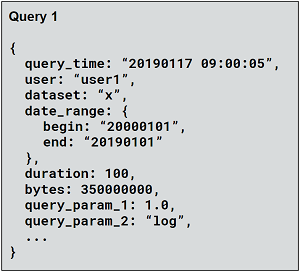
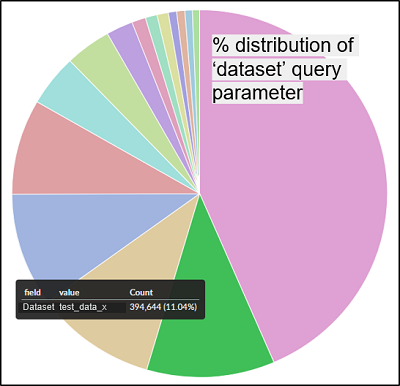
For effective product planning, we need to understand which features and query parameters people use, how queries are distributed across datasets, how all of this changes over time, etc. If we can collect query-specific information like what’s shown below, we can answer all of these usage questions.
In addition, by storing the data in its raw form, we are able to do exploratory analysis using dynamic “if that, then what?” questions. This allows us to shape our analysis as we go.
The challenge, then, is to collect this detailed data at query-level granularity (i.e., for each query that comes in). To keep up with the data platform, the metrics system must be highly performant and account for the bursts in queries the data platform handles.
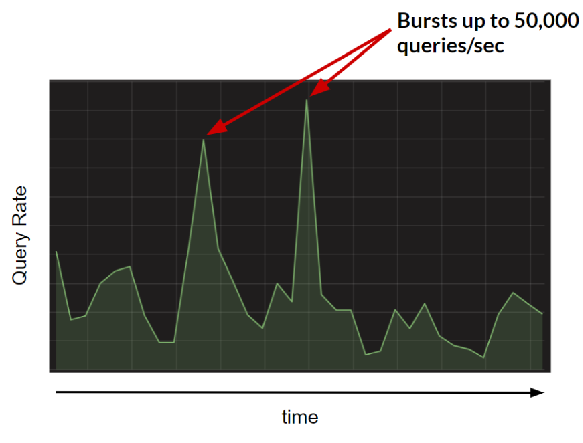
To summarize, the end goal is to collect and analyze these usage metrics with query-level granularity, without impacting the performance and reliability of the underlying data platform.
Of course, collecting metrics is not a novel engineering problem, so our gut tells us that we shouldn’t be building a system from scratch. While the specific requirements of our metrics system (e.g., able to handle high throughput, can index data for easy searching, has visualization tools for analysis) mean that there is likely no out-of-the-box solution for us, we can get creative and piece together different existing solutions to reach our end goal. Using open source offerings here as building blocks is a great way to do just that, and it’s a practice Two Sigma has long espoused.
A problem-solution approach to system design
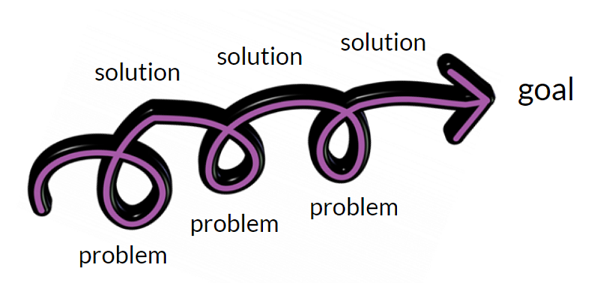
As scientists, we seek to define our problems first before seeking solutions. This is the methodology we took to designing and building the metrics systems.
Identifying and accurately defining the problem takes research and a holistic view of the end-goal. What is it that we really want to achieve? Why do we need to build a system to do that? What question(s) do we want to be able to answer at the end of the day?
Once we know the end goal of our system, we break down our overall problem into key subproblems, and look for solutions that fit together to help us achieve our goal.
For the metrics system, we identified four subproblems that needed solving:
- Where will the data be stored?
- How will the high throughput be handled?
- How will the data be transferred to the end storage?
- How will we ensure high availability of our entire solution?
Below is a preview of the final design of the system, which has open source components to address each of the subproblems.
We’ll dive into how we choose the right open source solutions to use, next.
The open source checklist
The open source community has been prolific in providing solutions for a wide array of problems. On the one hand, this is great, because it increases the likelihood of finding an open source solution that works for us. On the other hand, it can be harder to find the right solution when there are more options to sift through. Also, as a word of caution, not all open source products are equal! To figure out which open source products are safe and appropriate to use, we start by asking several key questions, including:
- Does a product have the right features and potential to solve our problem?
- Is it internally supported, and does it have an acceptable open-source license?
- Is it supported by an active open source community? How many active developers are there? When was the most recent commit/pull request?
- Is it extensible? (e.g., plugins, framework for extensions)
- Does it have a history of stable versioning? Are changes backward-compatible?
As we go through the design of this metrics system, we’re not going to discuss all of the potential open source technologies we considered in detail. Instead, we’ll focus on how we typically use these questions to select the right solution for every problem.
Problem 1: Where should the metrics data be stored?
We want to store the metrics data with flexible schema in case the information we want to collect changes (e.g., new query parameters are added). We also want to be able to analyze and visualize the data quickly. Doing an online search of open source data stores results in a list of offerings, from Apache Druid to Graphite to InfluxDB, PostgreSQL, TrailDB, Elasticsearch, and others. For every potential solution, we apply the criteria above and make a table to evaluate what the best option is:
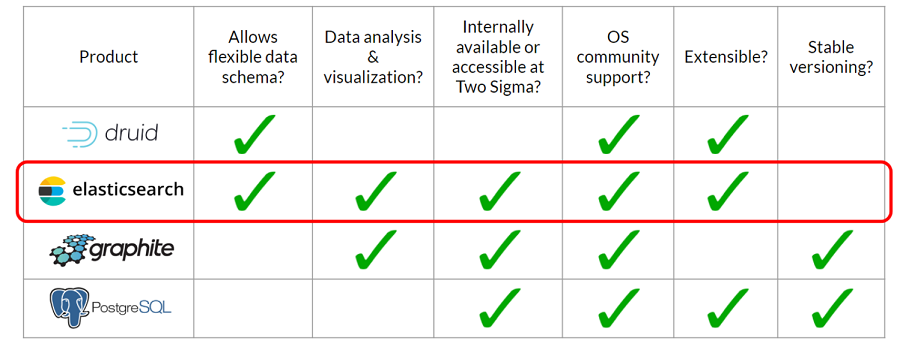
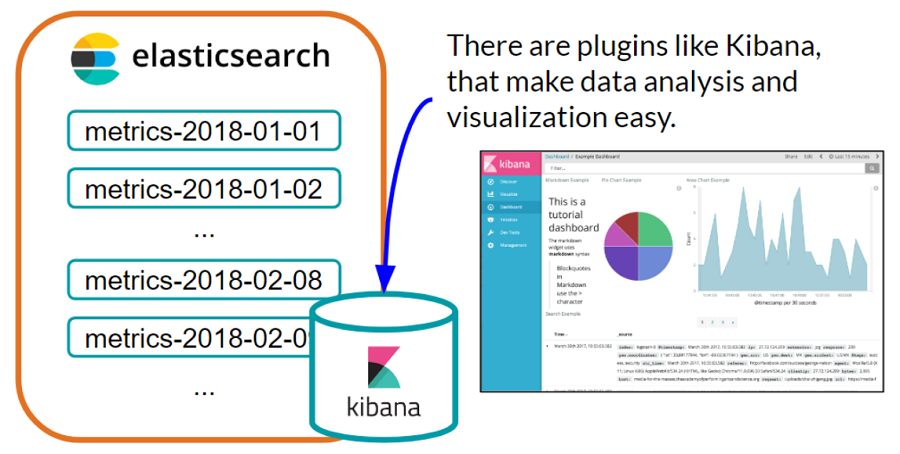
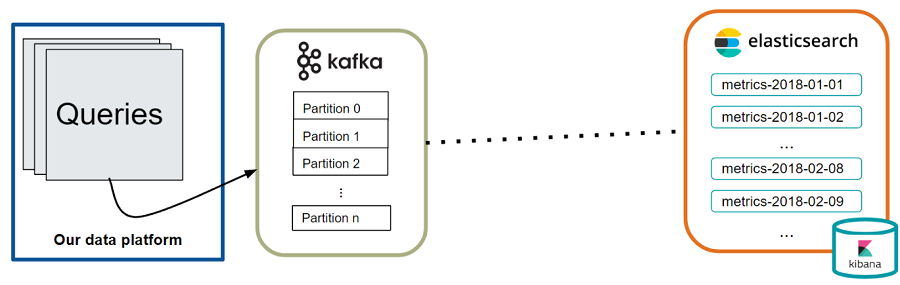
Solution to problem 1: Elasticsearch (with the Kibana plugin)
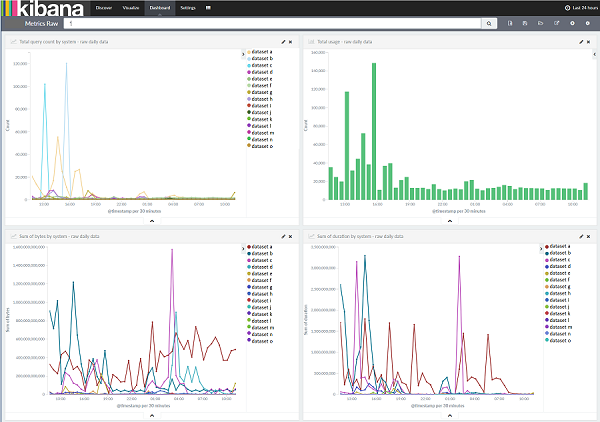
Elasticsearch is the winner in this comparison. It’s an open source platform that can store event data for easy searching and analysis, and it comes with plugins, like Kibana, that make data analysis and visualization easy. We don’t have to go and build our own front end or data query engine to aggregate and graph the data—a big timesaver. It also has indexes for organizing data, and we can create an index per day to make for searching and archiving across time easy. Elasticsearch also has robust internal support at Two Sigma making it a great option for teams to use.
Problem 2: How do we handle the high throughput?
We want to store the metrics data in Elasticsearch, but Elasticsearch wasn’t built to handle 50,000 messages per second (we tested this through internal benchmarks).
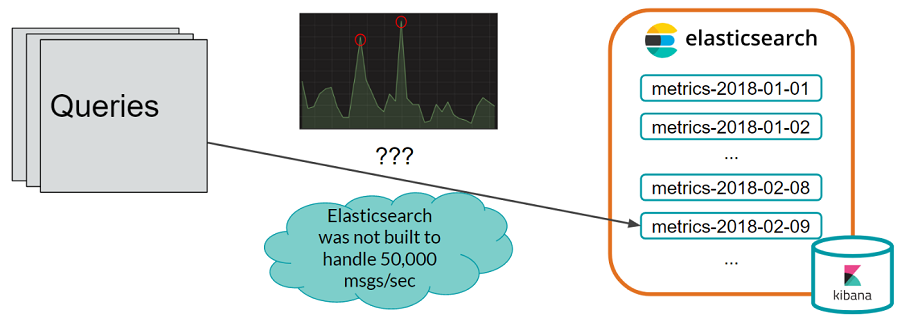
Since we don’t want Elasticsearch performance to hurt the performance of our data platform (i.e., we don’t want to slow down the data platform just so we can wait for Elasticsearch to save the metrics data), we need a buffer to handle the throughput bursts.
The buffer is analogous to a water tank. If the buffer has a wide pipe leading into it and can be written to quickly, it can smooth the throughput bursts. The process reading from the buffer can be slower as long as the reading process is steady, and the buffer won’t overflow. Again, looking at open source offerings, we can use the checklist discussed earlier to compare them:
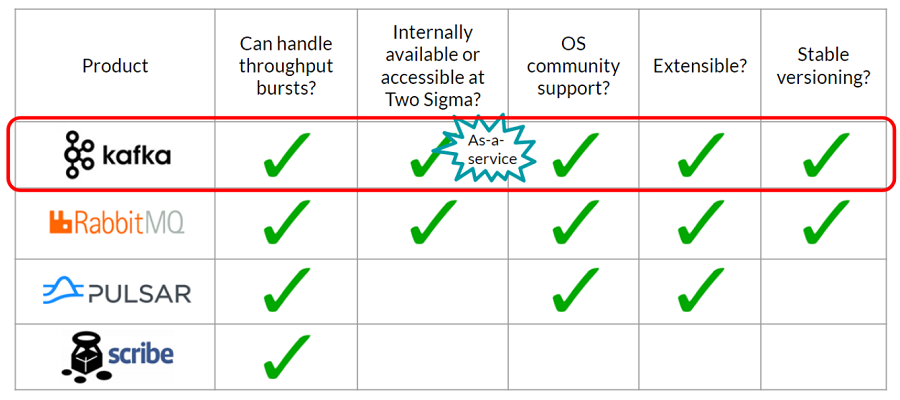
Kafka and RabbitMQ are similar, but Kafka proved to be the best option, since it was provided as-a-service at Two Sigma, making it very easy to set up and use.
Solution to problem 2: Use Kafka as a buffer
Kafka is an open source streaming platform that allows us to produce (write) data to and consume (read) data from a Kafka topic.
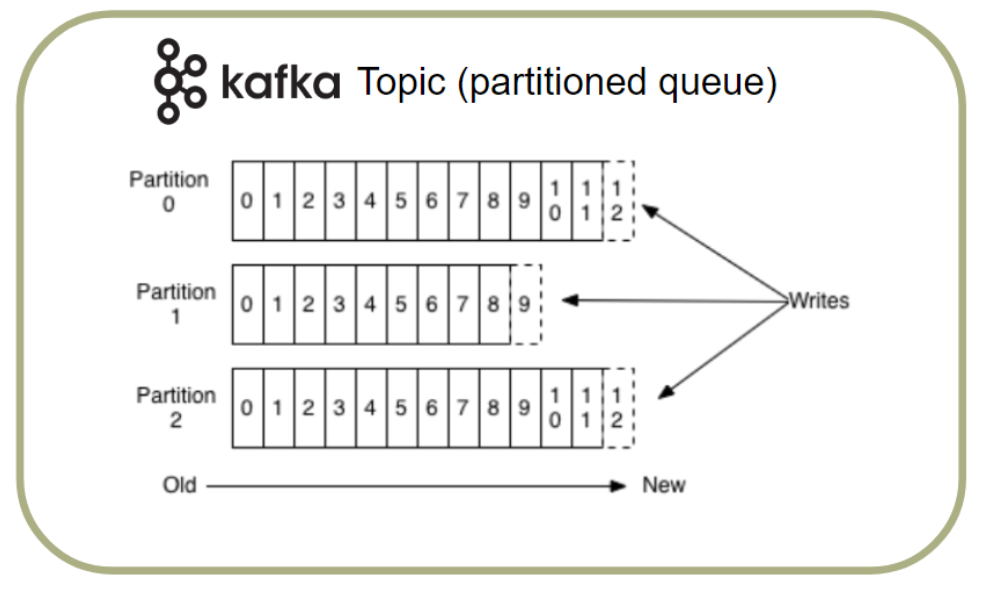
You can think of a Kafka topic as a partitioned queue where the partitions can be written to and read from simultaneously. Therefore, Kafka is designed for high throughput and low latency and can handle the throughput bursts that Elasticsearch couldn’t. We can use Kafka as an intermediary buffer to store the metrics data before writing to Elasticsearch.
Problem 3: How is the metrics data transferred from Kafka to Elasticsearch?
We could have created our own Kafka consumer group to read the data from Kafka and then used the Elasticsearch Java or REST API to index the data into Elasticsearch. However, that would require a lot of application code, including proper testing of edge cases and handling of errors to prevent data loss. Looking at open source, there were already several messaging solutions for connecting different platforms like Kafka and Elasticsearch.
Sense a pattern?
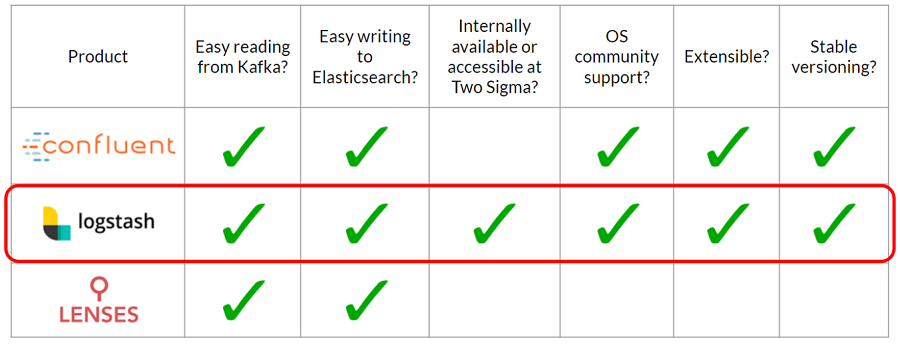
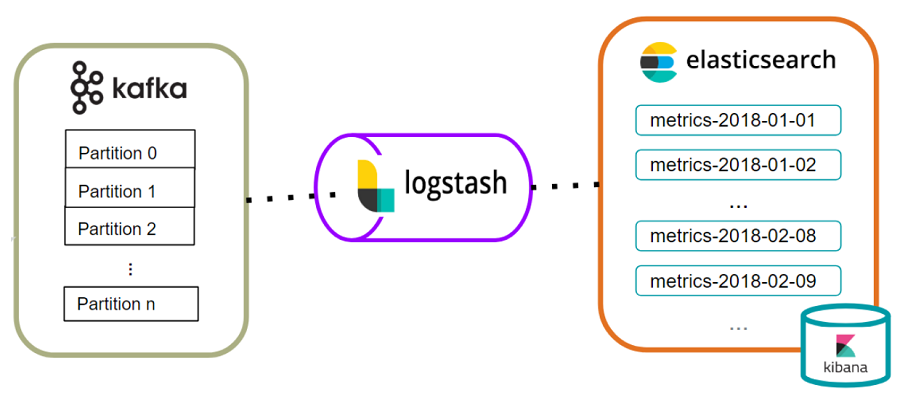
Solution to problem 3: Use logstash as a pipeline
Logstash is part of the commonly known ELK (Elasticsearch-Logstash-Kibana) stack and is a data processing pipeline that ingests, transforms, and stashes the data into a storage solution of our choice. We can use logstash to ingest data from Kafka, transform it by adding Elasticsearch-compatible timestamps, and stash the results in Elasticsearch.
Instead of writing hundreds of lines of code, all this is doable with a simple configuration file that specifies the input, filter, and output plugins—a total of 20 lines!
As an added bonus, logstash can scale up to the number of partitions in the Kafka topic, and it’s as easy as starting more logstash instances with the same configuration shown above.
Problem 4: How do we ensure high availability?
Elasticsearch, Kibana, and Kafka have robust internal support at Two Sigma and are managed by the Infrastructure Reliability Engineering team. This means that these components of our system are highly available. Logstash, on the other hand, is more self-service.
With multiple logstash instances, we need a way to manage them. It’s no longer possible to simply start a single executable and monitor it manually. There are many open source solutions for process management, and we picked a few to compare.
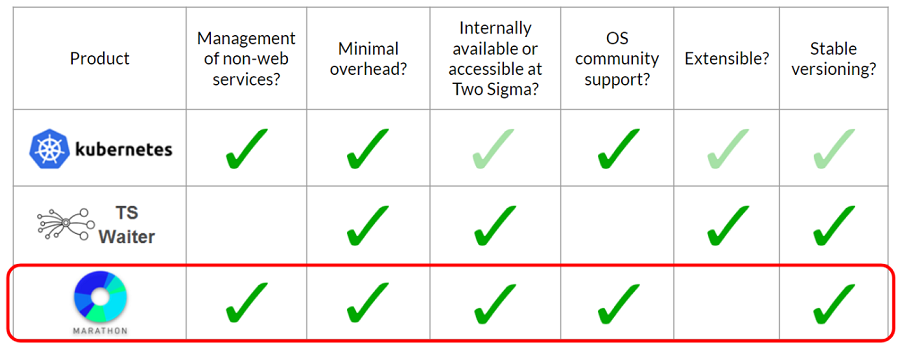
Kubernetes, a mainstream open source container management solution, checks all of the boxes, but at the time of building this system (mid-2017), it wasn’t generally available at Two Sigma and was not as extensible or stable as it is today. Waiter, a Two Sigma-originated open source product, is a great in-house solution for scaling and monitoring web applications, but logstash isn’t a web service. This leaves us with Apache Marathon, a good lightweight solution for process management.
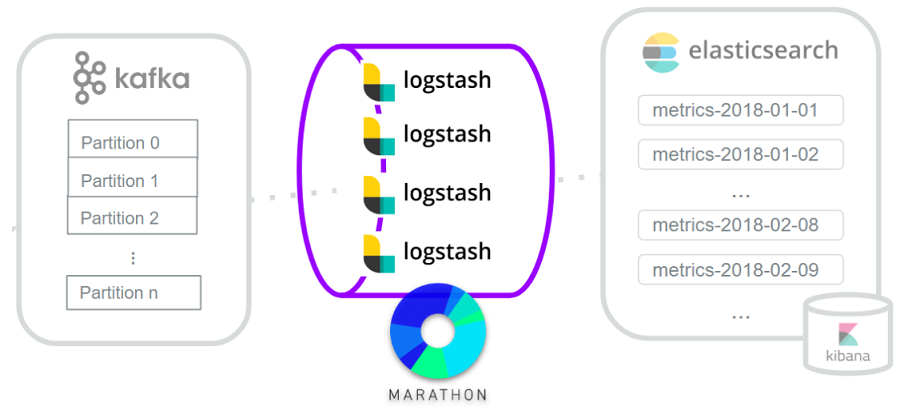
Solution to problem 4: Use Marathon to keep logstash instances up and running
Marathon is an open source container orchestration platform. It schedules, monitors, and restarts applications as needed. We use Marathon to manage our logstash instances and keep them up and running 24/7.
The complete system
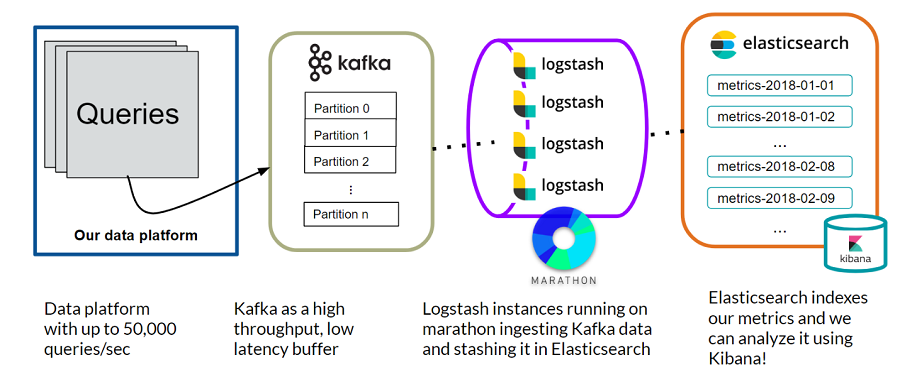
By breaking down the initial problem into four subproblems and applying the open source checklist, we constructed a metrics system using open source tools. This is another overview of the complete system:
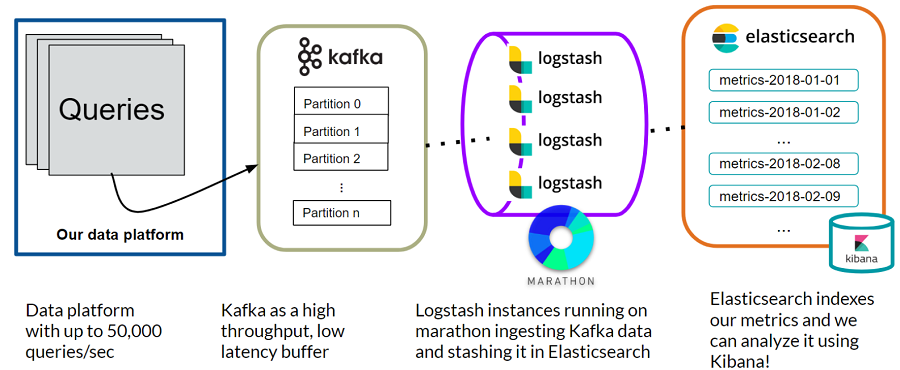
Query data is collected from the data platform and sent to Kafka which acts as a high throughput, low latency buffer. Logstash instances running on Marathon ingest the Kafka data and stash it in Elasticsearch. Elasticsearch then indexes the metrics data and we can analyze and visualize everything easily using Kibana!
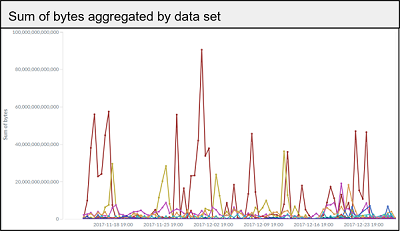
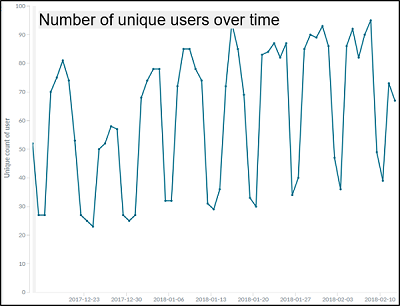
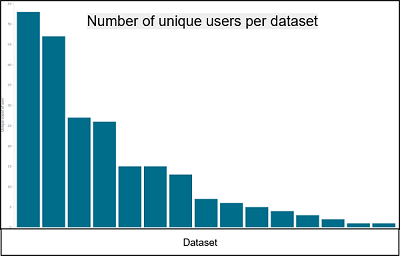
Results
The metrics system has been up and running with little to no downtime since its inception with minimal support burden, and this is some of the analysis we’ve been able to do.
Engineering lessons learned
The advantages of using open source software are clear, and this article explains one way to approach system design using open source as building blocks. Just remember these rules of thumb: requirements should shape the system you build; choose your open source solutions wisely, and use them when you can; and often it’s not about writing the code but about orchestrating the pieces and fitting them together with the right configurations.