
On Wednesday April 18, 1951, the prince of Belgium, the grand duchess of Luxembourg, the queen of the Netherlands, and the presidents of Germany, France, and Italy signed the treaty establishing the European Coal and Steel Community, which would become known as the Treaty of Paris. In the wake of World War II, these European countries hoped to create an organized and vital Europe through the establishment of economic ties.
Like marching soldiers, European countries have since steadily trudged towards an ever-closer union. A vote by British citizens on June 23 may break that stride, as the United Kingdom decides whether it wants to remain in the European Union.
Quantifying Brexit’s effect on asset returns
Recognizing the significance of a “Brexit” event appears easy. Identifying its effect on asset returns, on the other hand, proves more difficult. Few relevant historical case studies exist, particularly because the legal and institutional implications for a country to leave the European Union remain unknown (e.g., Will the Schengen Area or the common market end? Will other countries follow the UK’s example?). In theory, prediction or betting market information joined with other data sets could offer quantitative insights. In practice, these markets suffer from limited depth on the Brexit topic, particularly over the time horizons necessary to derive statistical confidence for an empirical analysis.
Translating news and other web stories into data and studying asset volatility may offer a second-best option. An analysis of search-volume from November 2015 through June 10, 2016 shows that Brexit seems to affect assets related to longer-term economic effects, like corporate profitability and default risk (e.g., FTSE, five year CDS spreads on UK sovereign debt), more than assets tied to monetary policy (e.g., ten-year Gilts and the GBP exchange rates).
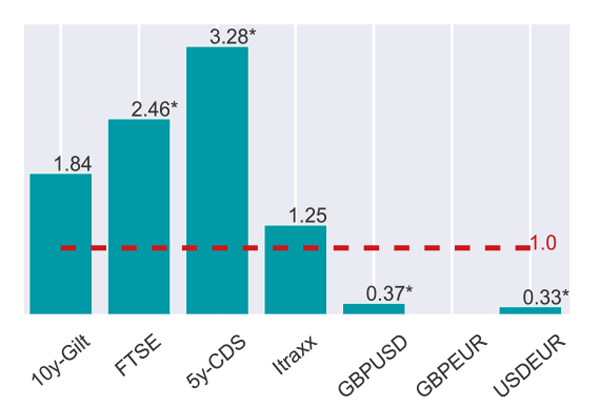
Asterisk denotes significance at the 10 per cent level.
Source: Bloomberg data and authors’ computation. Data as of June 10, 2016.