
Every four years the same debates resurface. Was 1970 really the greatest? Does 1982 deserve more credit? Is 2022 already a classic? Outlets from
Sports Illustrated to Sports Mole have all weighed in ahead of 2026, and while the rankings differ, the methodology is always editorial — gut feel, memorable moments, iconic players. It makes for great reading. But at a firm that runs on data, we thought we could go further. So we built a scoring model — and we’re going to run it live, all tournament long.
Every week, we’ll update the numbers and ask: is 2026 tracking to be the greatest World Cup ever played?
First, a little context
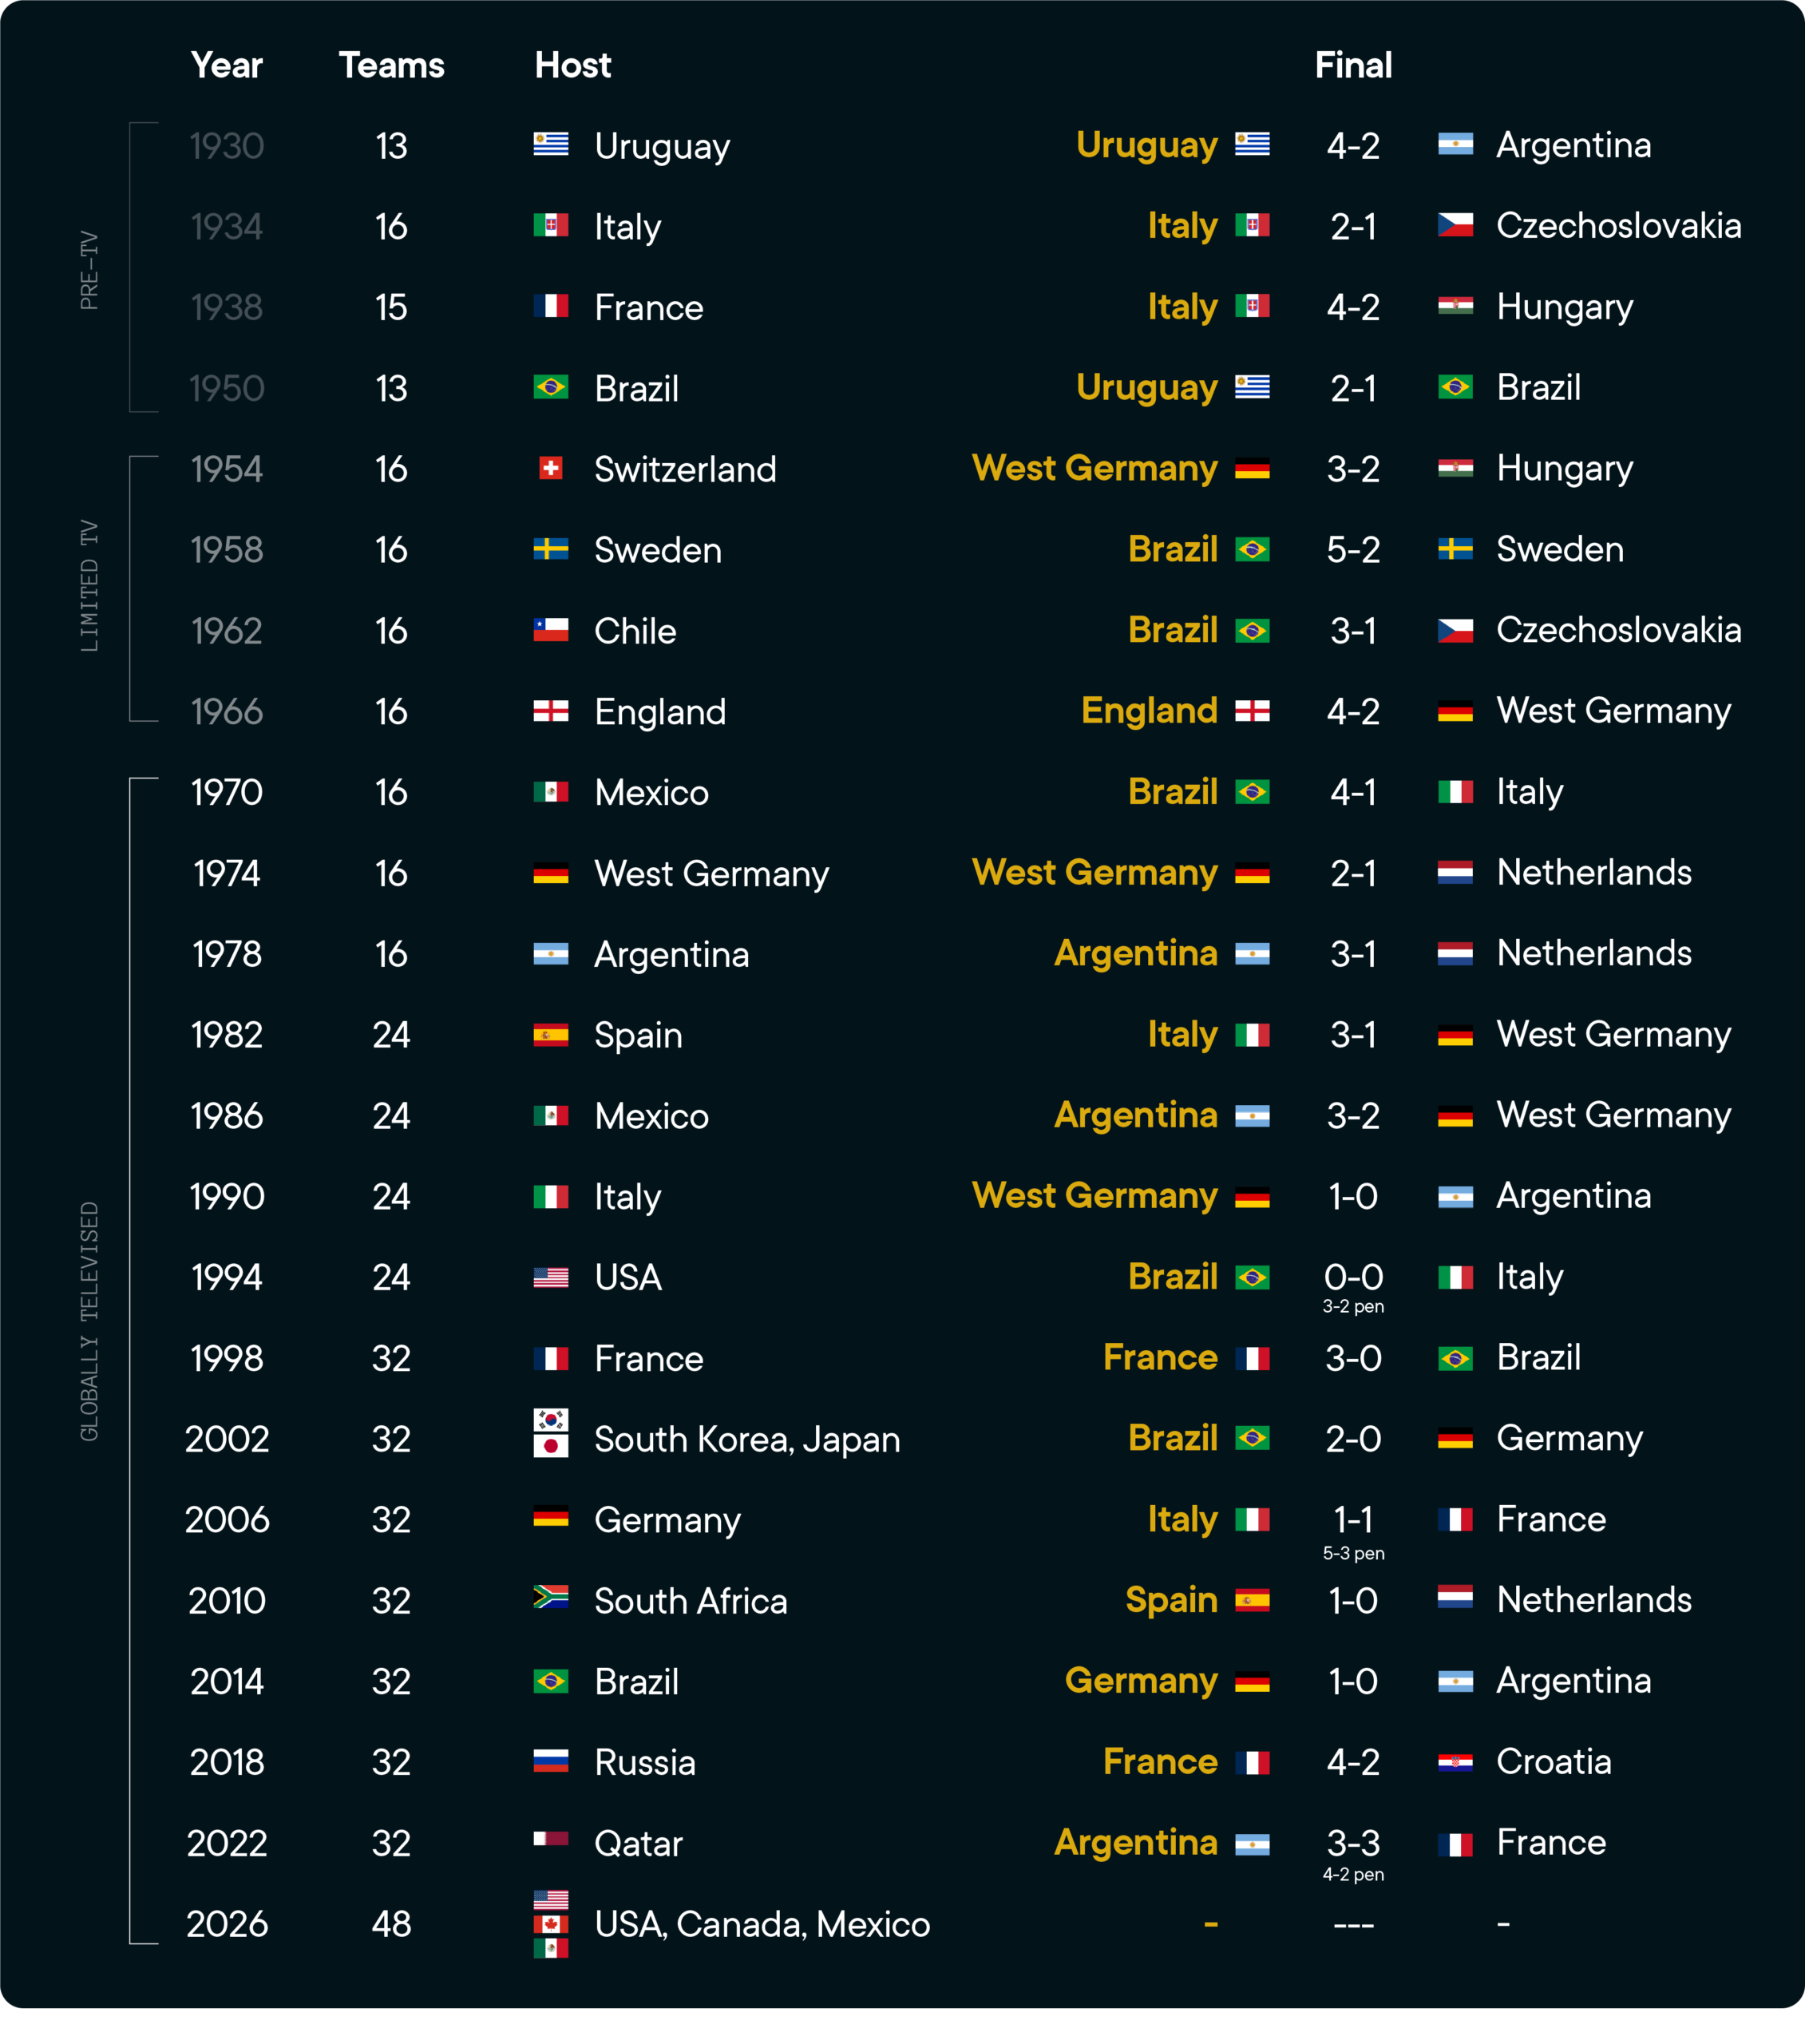 The FIFA World Cup has been running since 1930, when just 13 nations made the trip to Uruguay for the inaugural tournament. It grew to 16 teams through most of the mid-century era, expanded to 24 in 1982, and then to 32 in 1998. Starting today, 2026 becomes the first ever 48-team World Cup, spread across the United States, Canada, and Mexico. Yes it’s the biggest but will it be the best?
In the 22 editions played so far, the range of quality has been extraordinary. Some tournaments have passed into legend. 1970 in Mexico, for example, is where Brazil played football so beautiful it made grown men weep. Or 1986, again in Mexico, where Maradona essentially won a World Cup by himself. Other tournaments have passed into infamy. Take Italia 1990, which produced a record low of 2.21 goals per game and a final so bad it prompted FIFA to change the rules. Or 2010, when we all (unfortunately) learned about the vuvuzela. Between the sublime and the forgettable lies 90 years of football history. Where will 2026 fall?
How we built our model
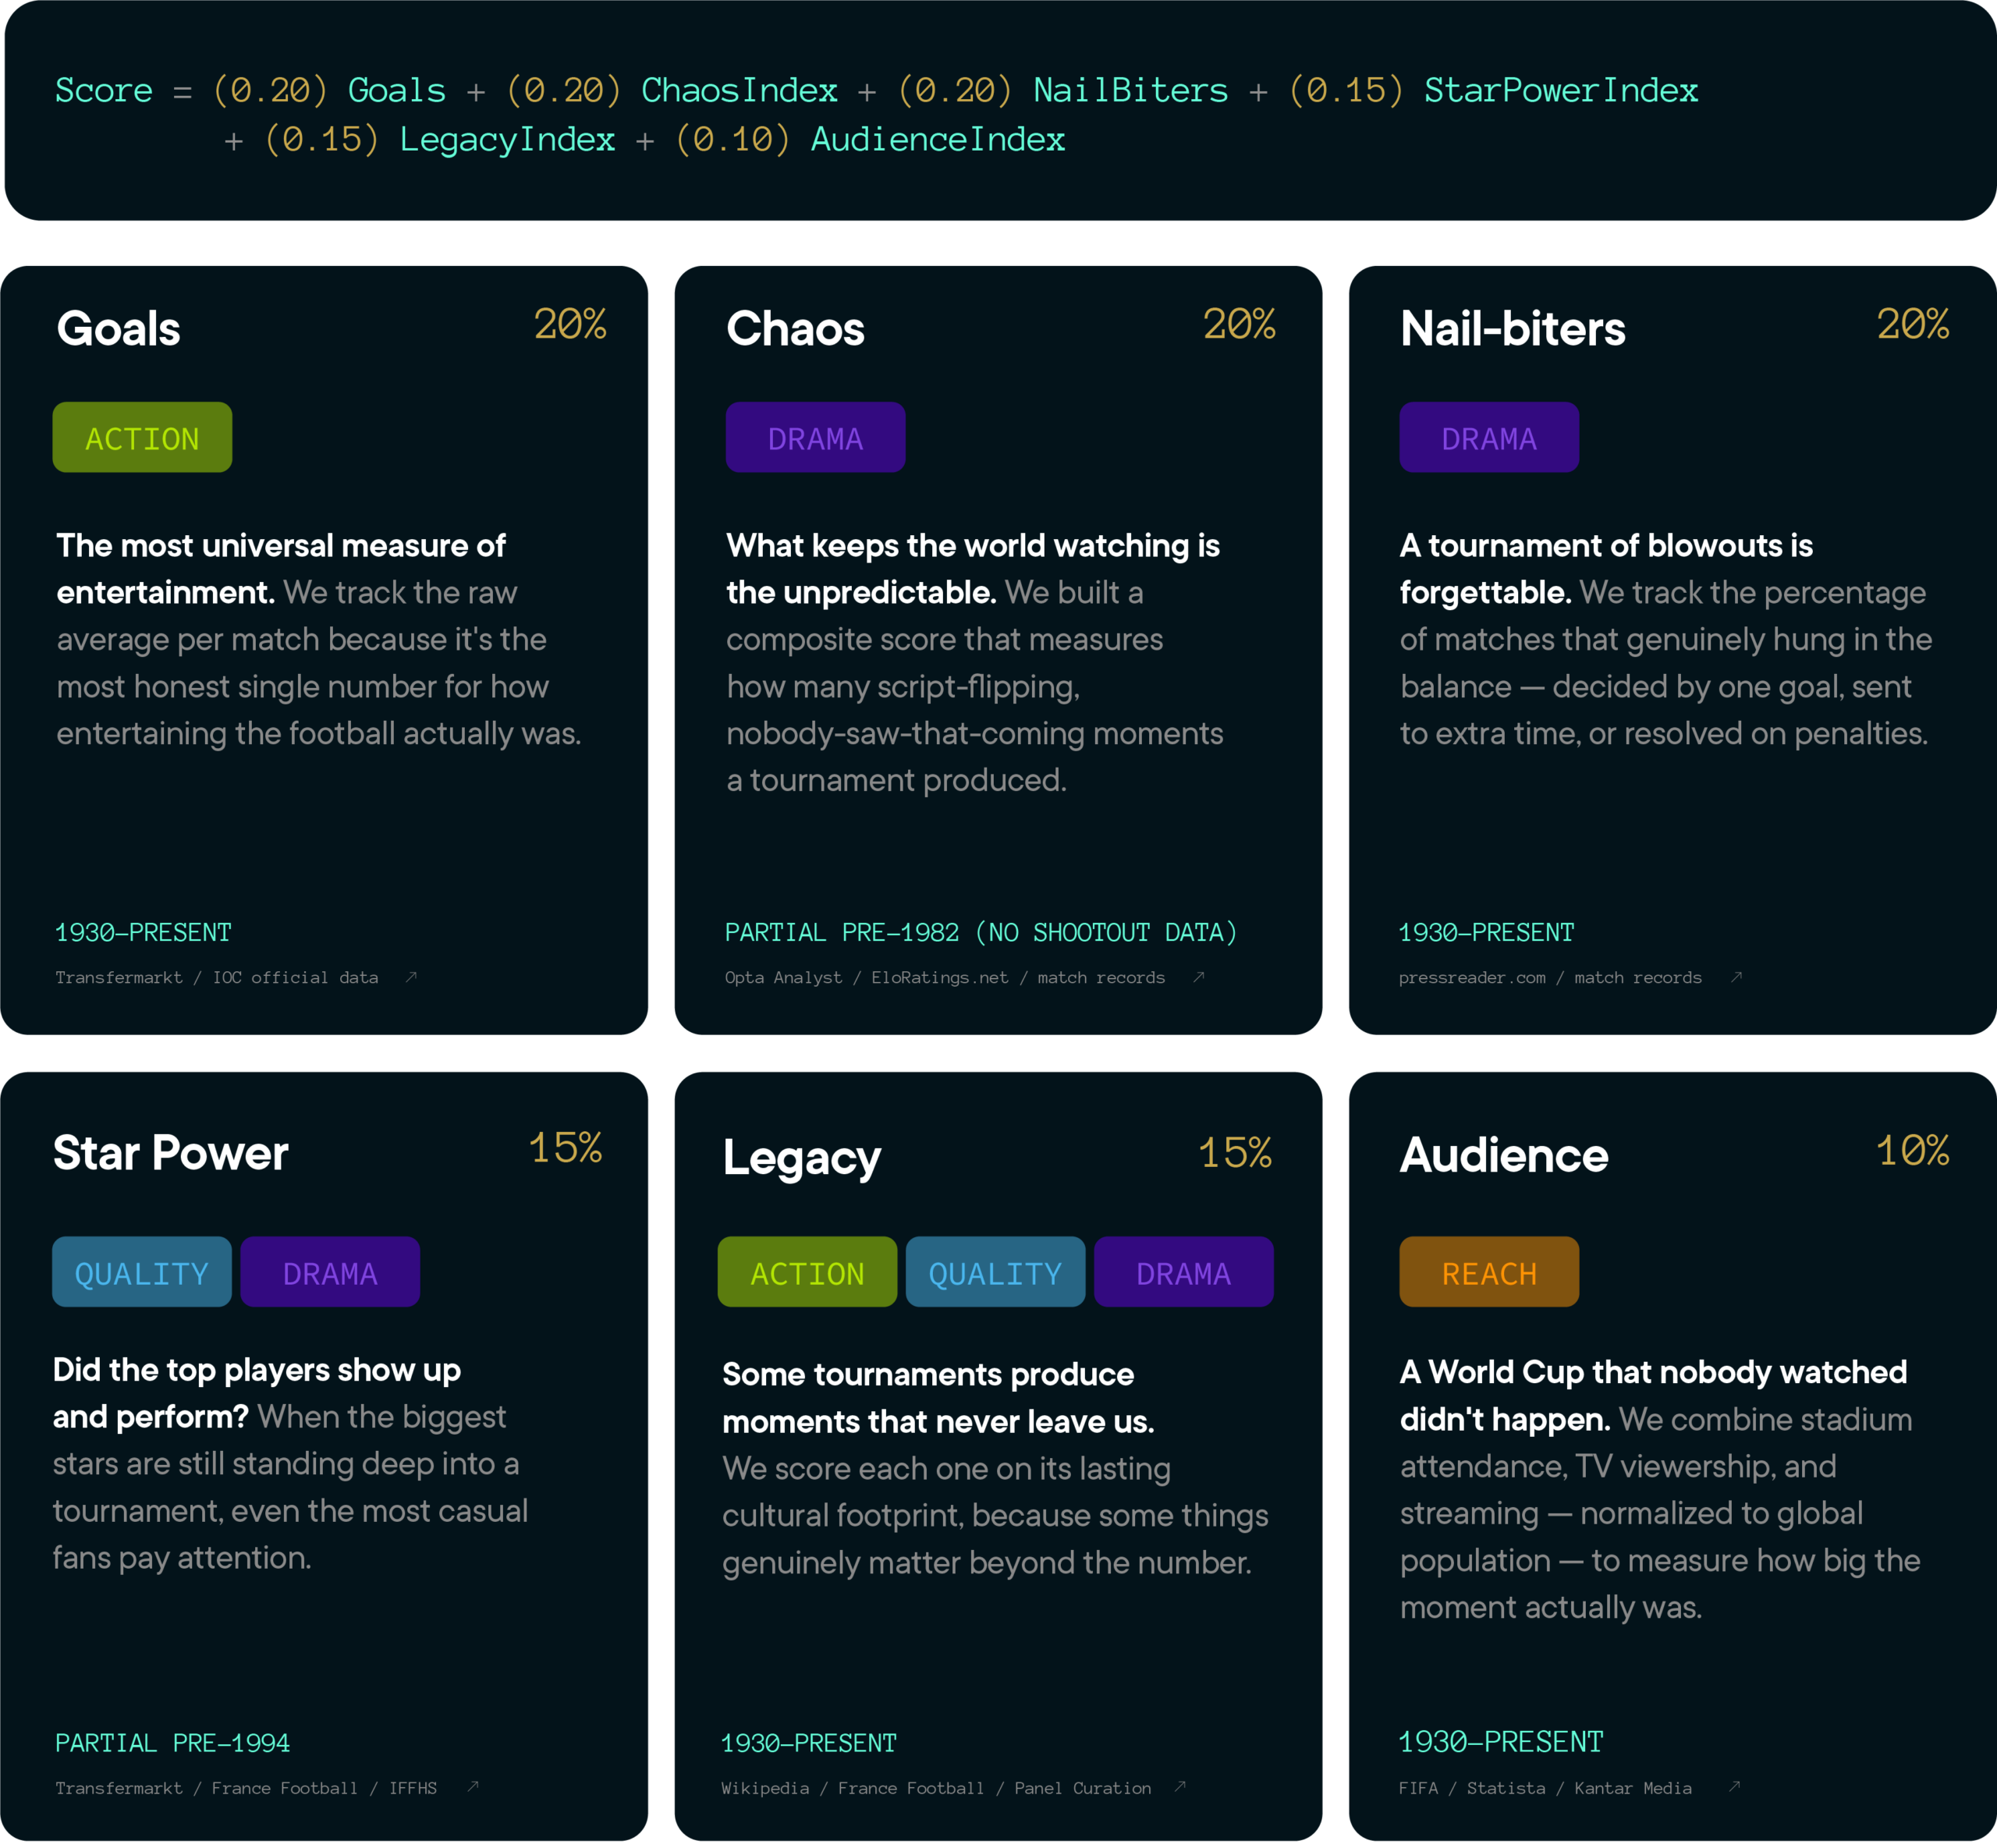
We wanted a scoring system that covers every World Cup back to 1930 and can be updated in real time as 2026 unfolds. Six metrics tracked against all 22 prior tournaments. Four are normalized to a 0–10 index; goals per game and nail-biters are displayed as raw data (goals per game average and % of close matches) and normalized internally for the composite score.
Score = (0.20 × Goals) + (0.20 × ChaosIndex) + (0.20 × NailBiters) + (0.15 × StarPowerIndex) + (0.15 × LegacyIndex) + (0.10 × AudienceIndex)
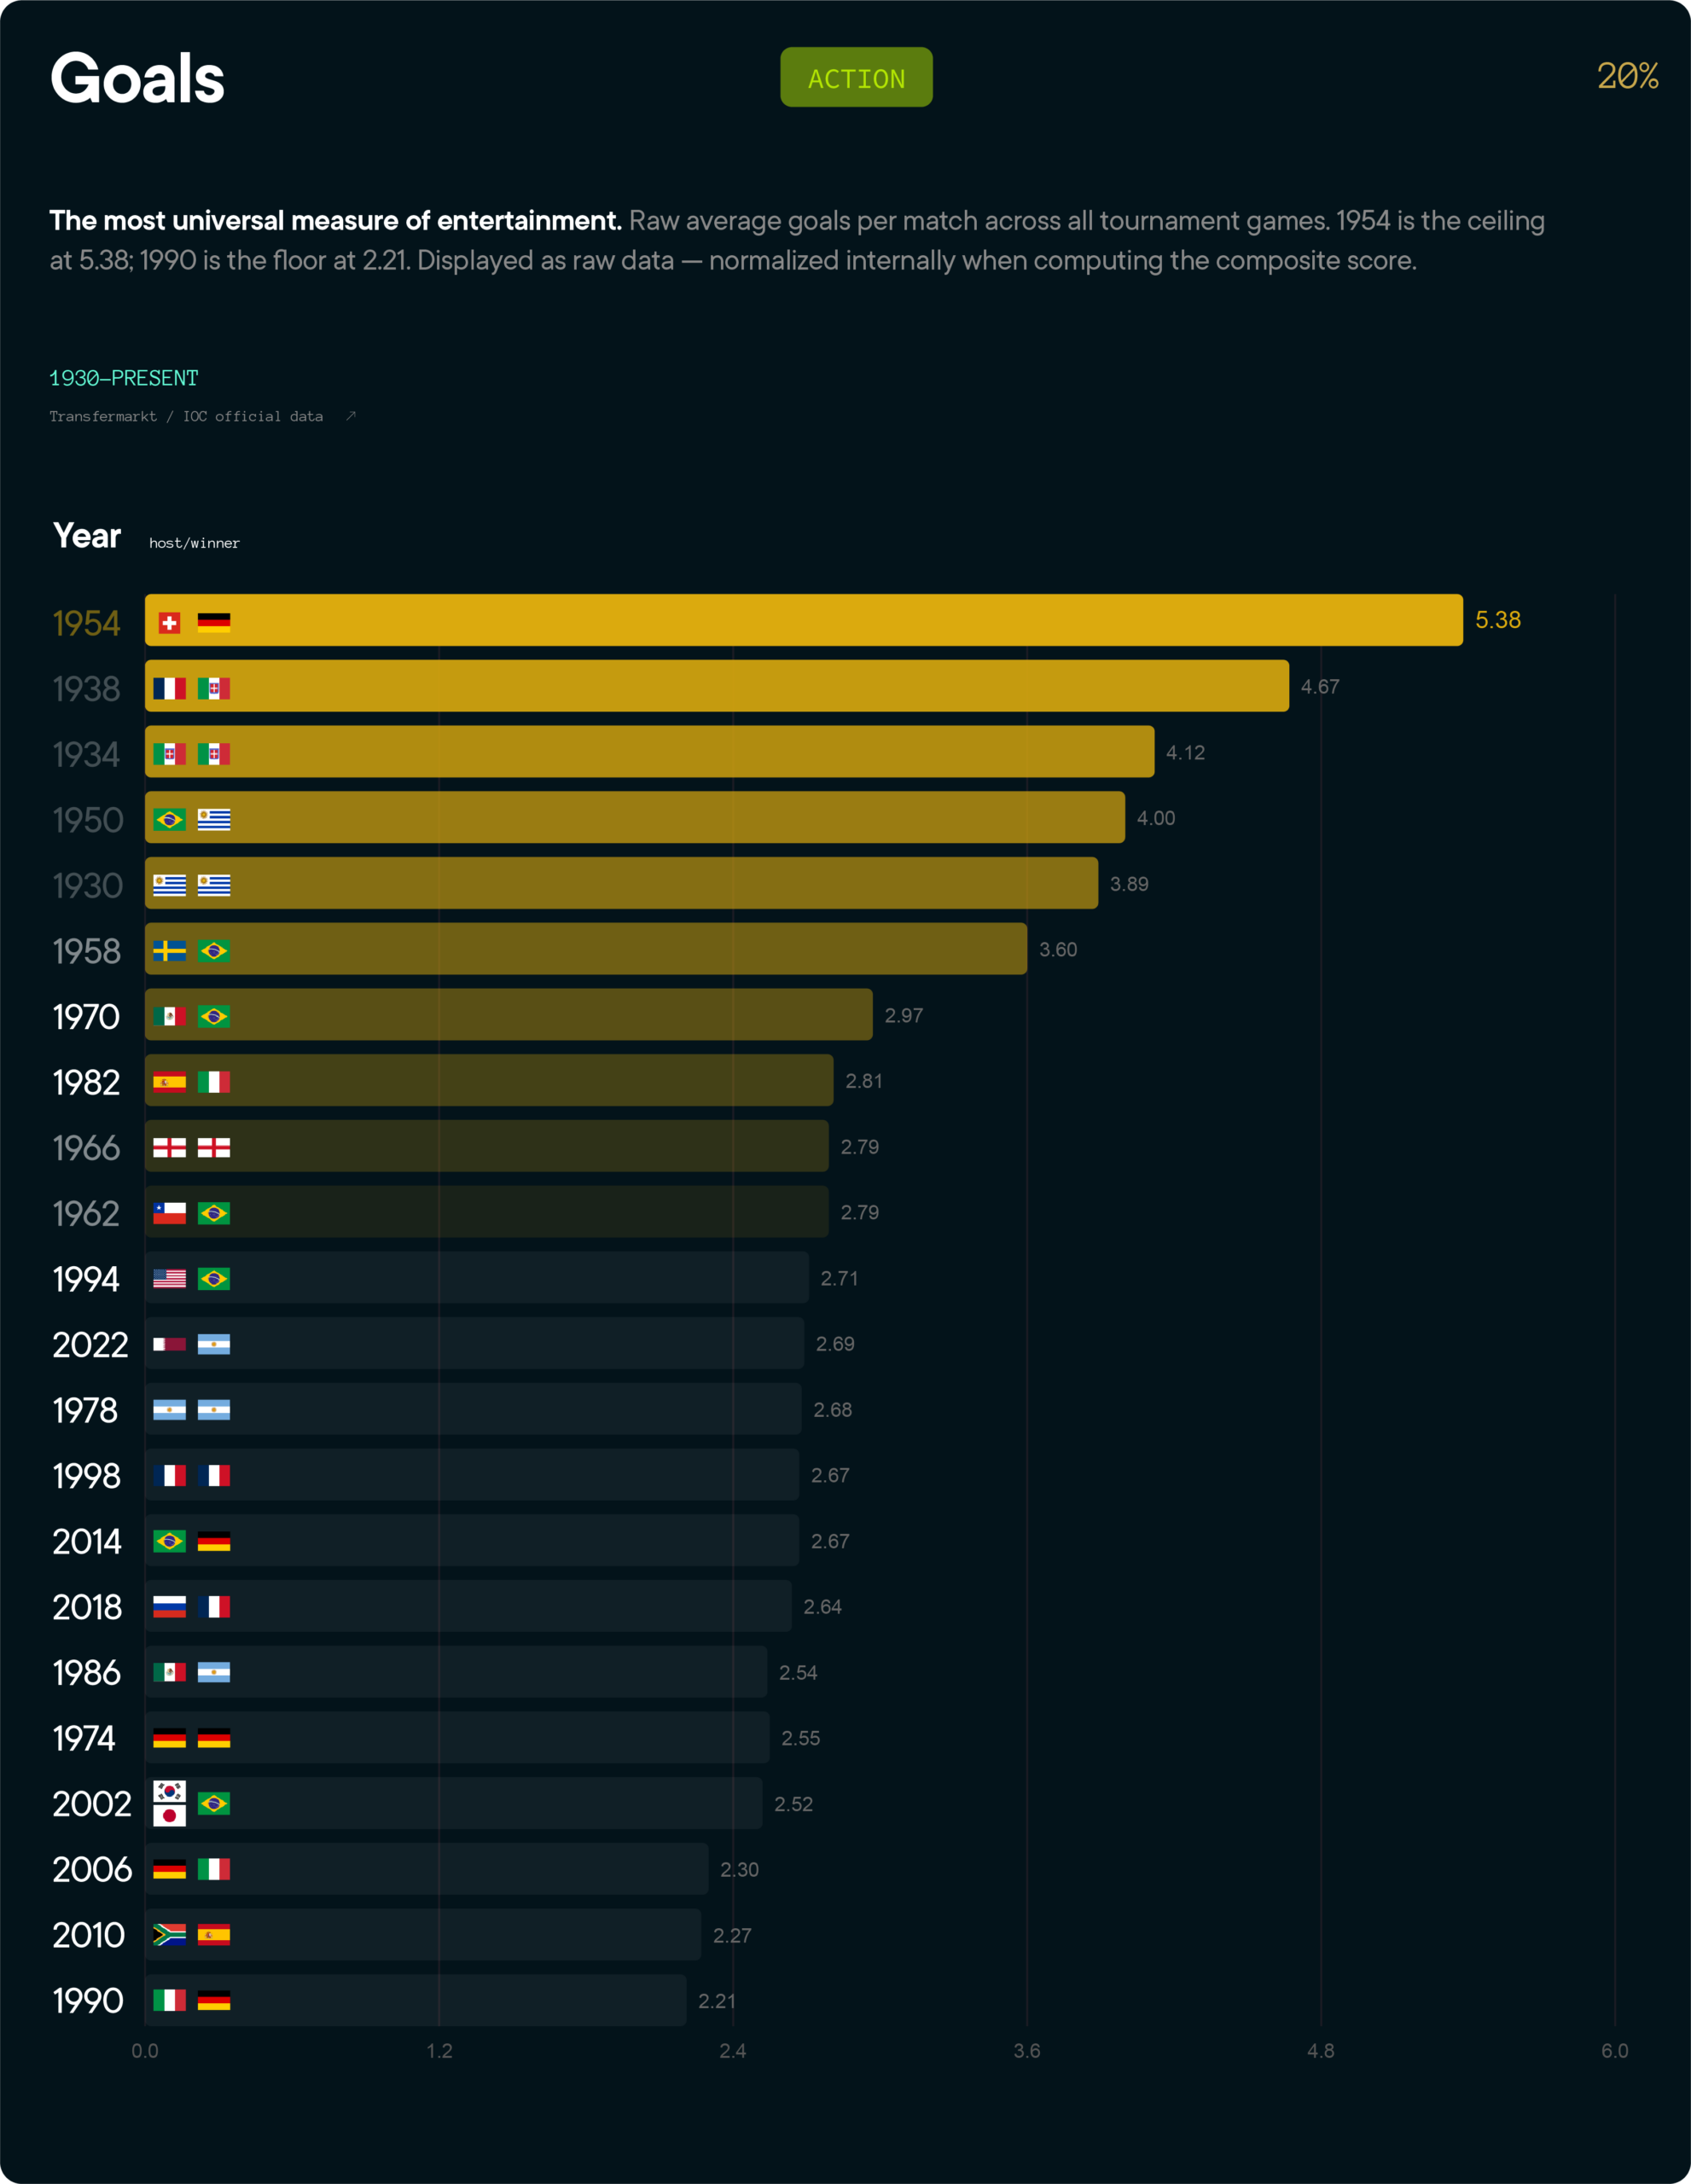
Goals (20%) — Football is, at its core, about the ball going in the net. A World Cup that produces goals produces joy, and a World Cup that produces lots of goals tends to produce lots of memorable goals. We track the raw average per match because it’s the most honest single number for how entertaining the football actually was.
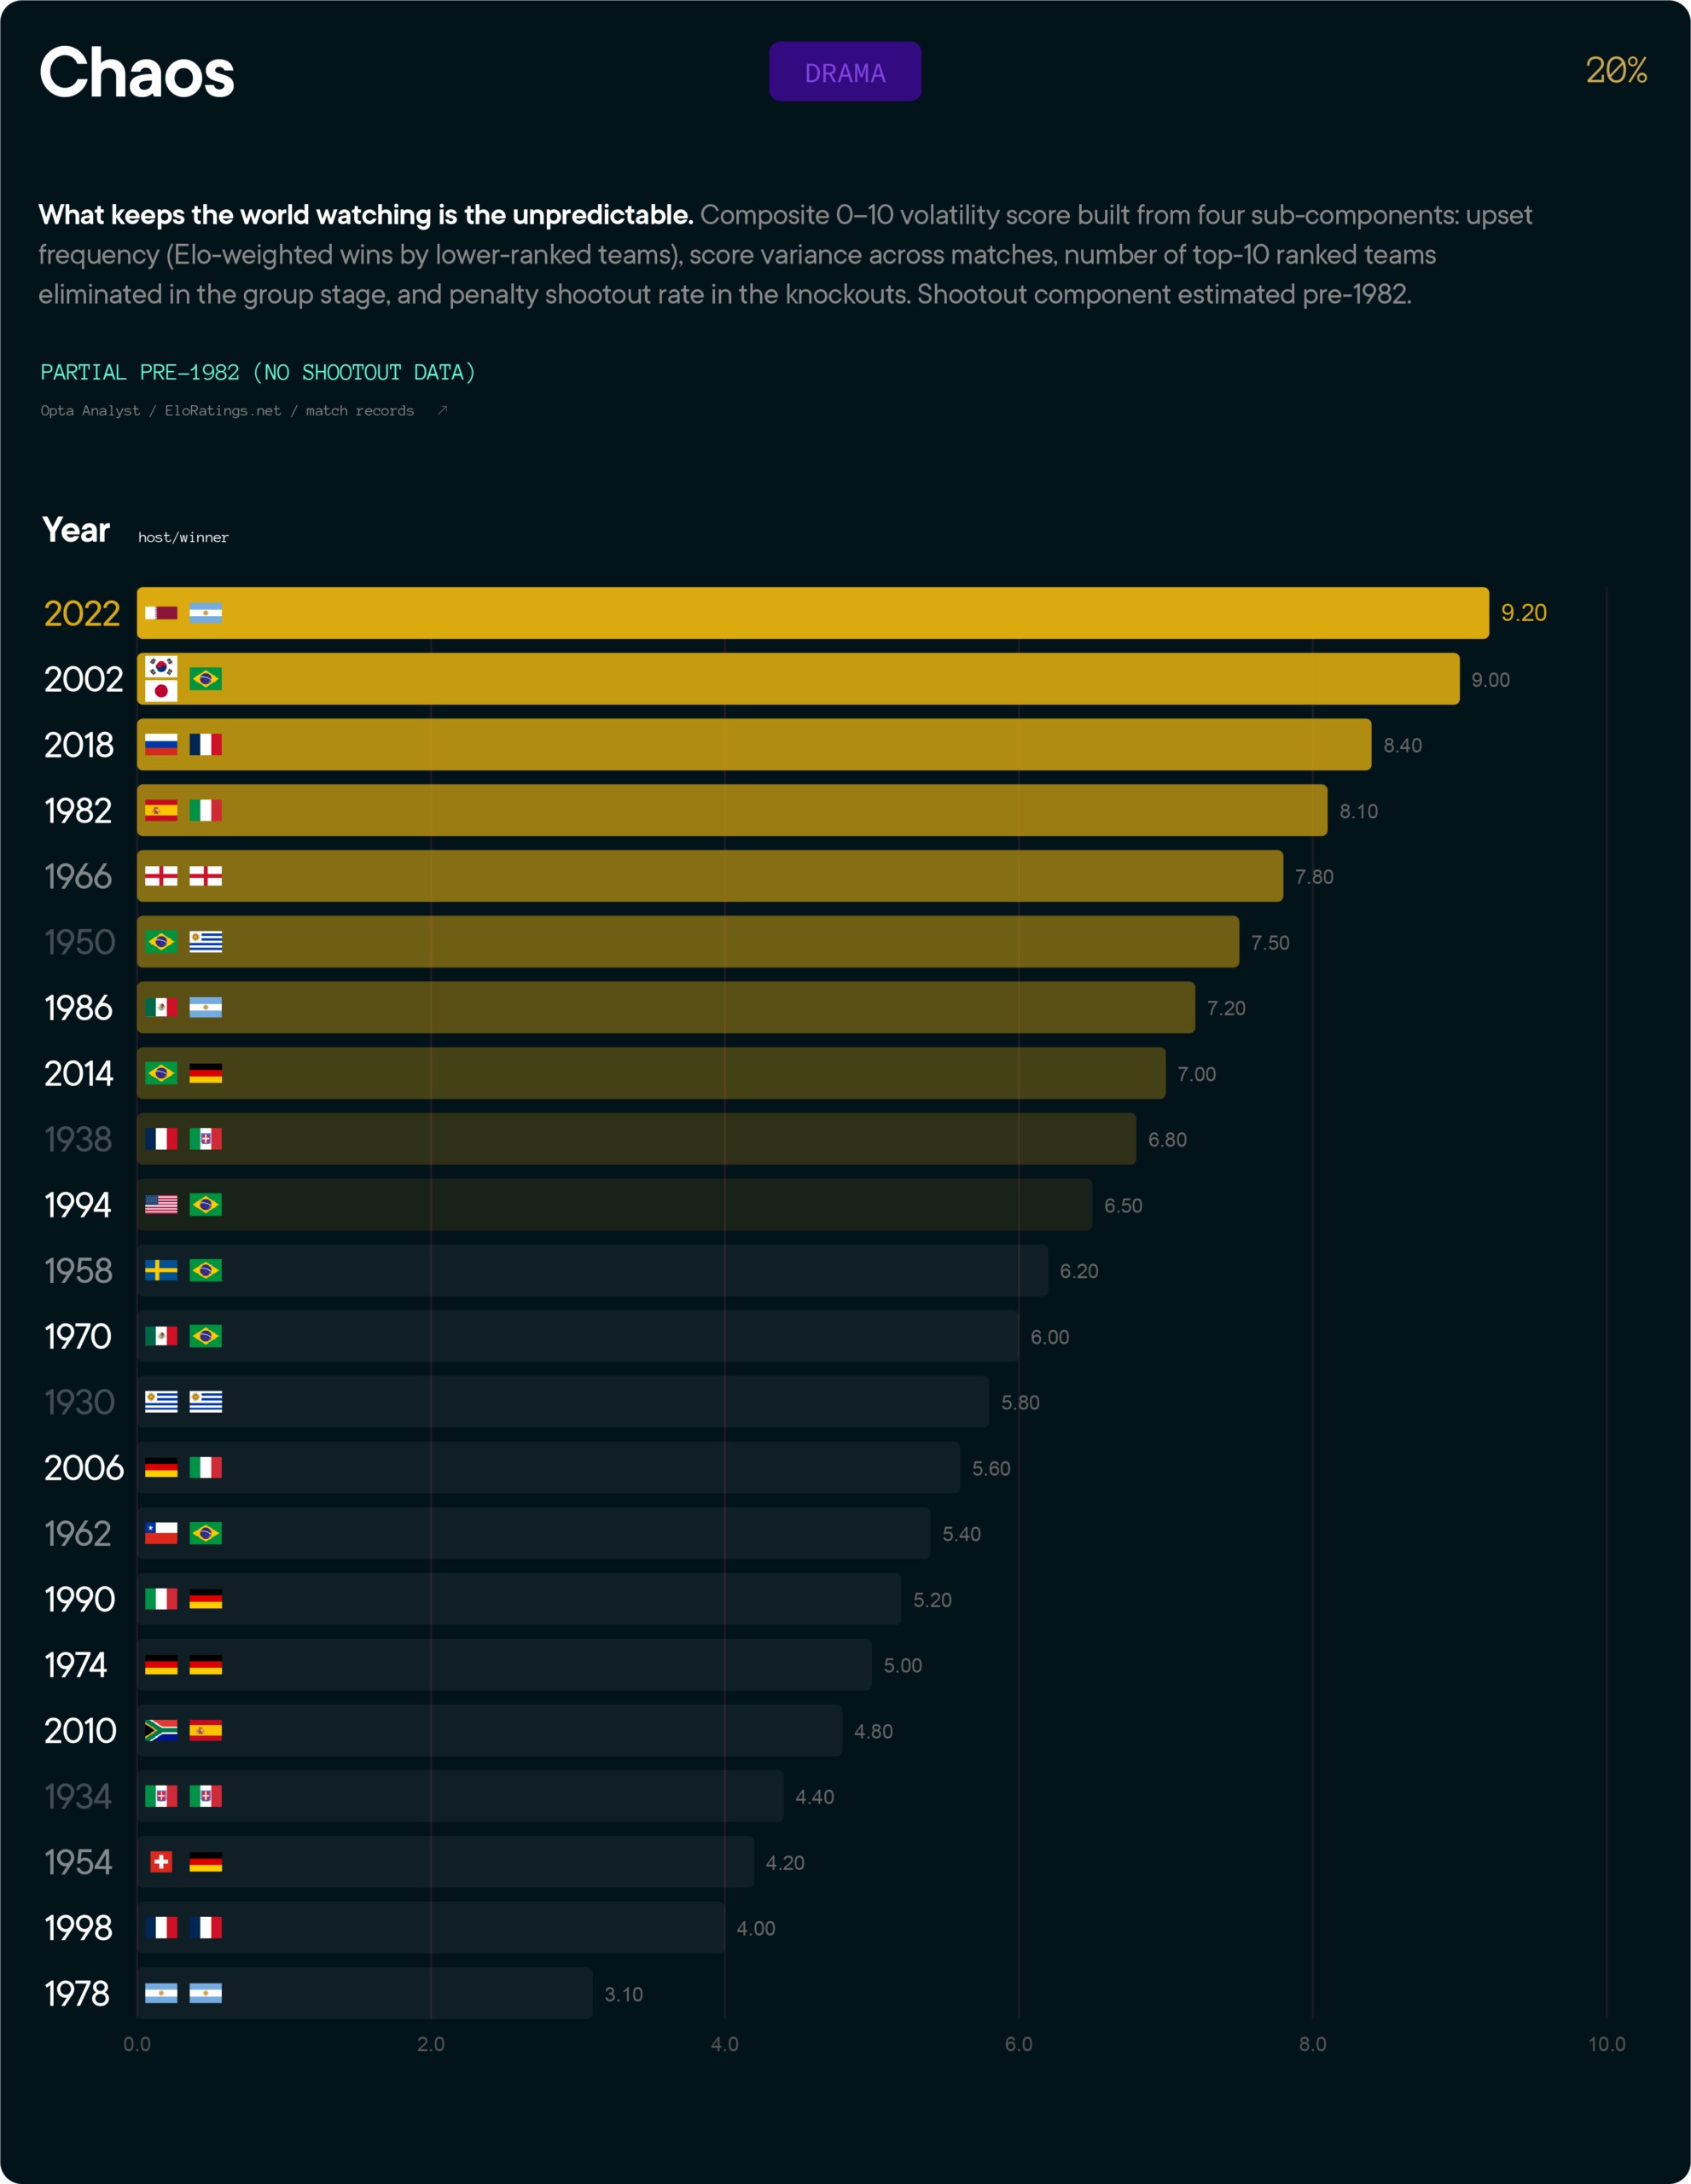
Chaos (20%) — The World Cup isn’t just a football tournament, it’s a global event, and what keeps the world watching is the unpredictable. The chaos index measures how many of those moments a tournament produced: the upsets, the volatility, the shocks that nobody saw coming.
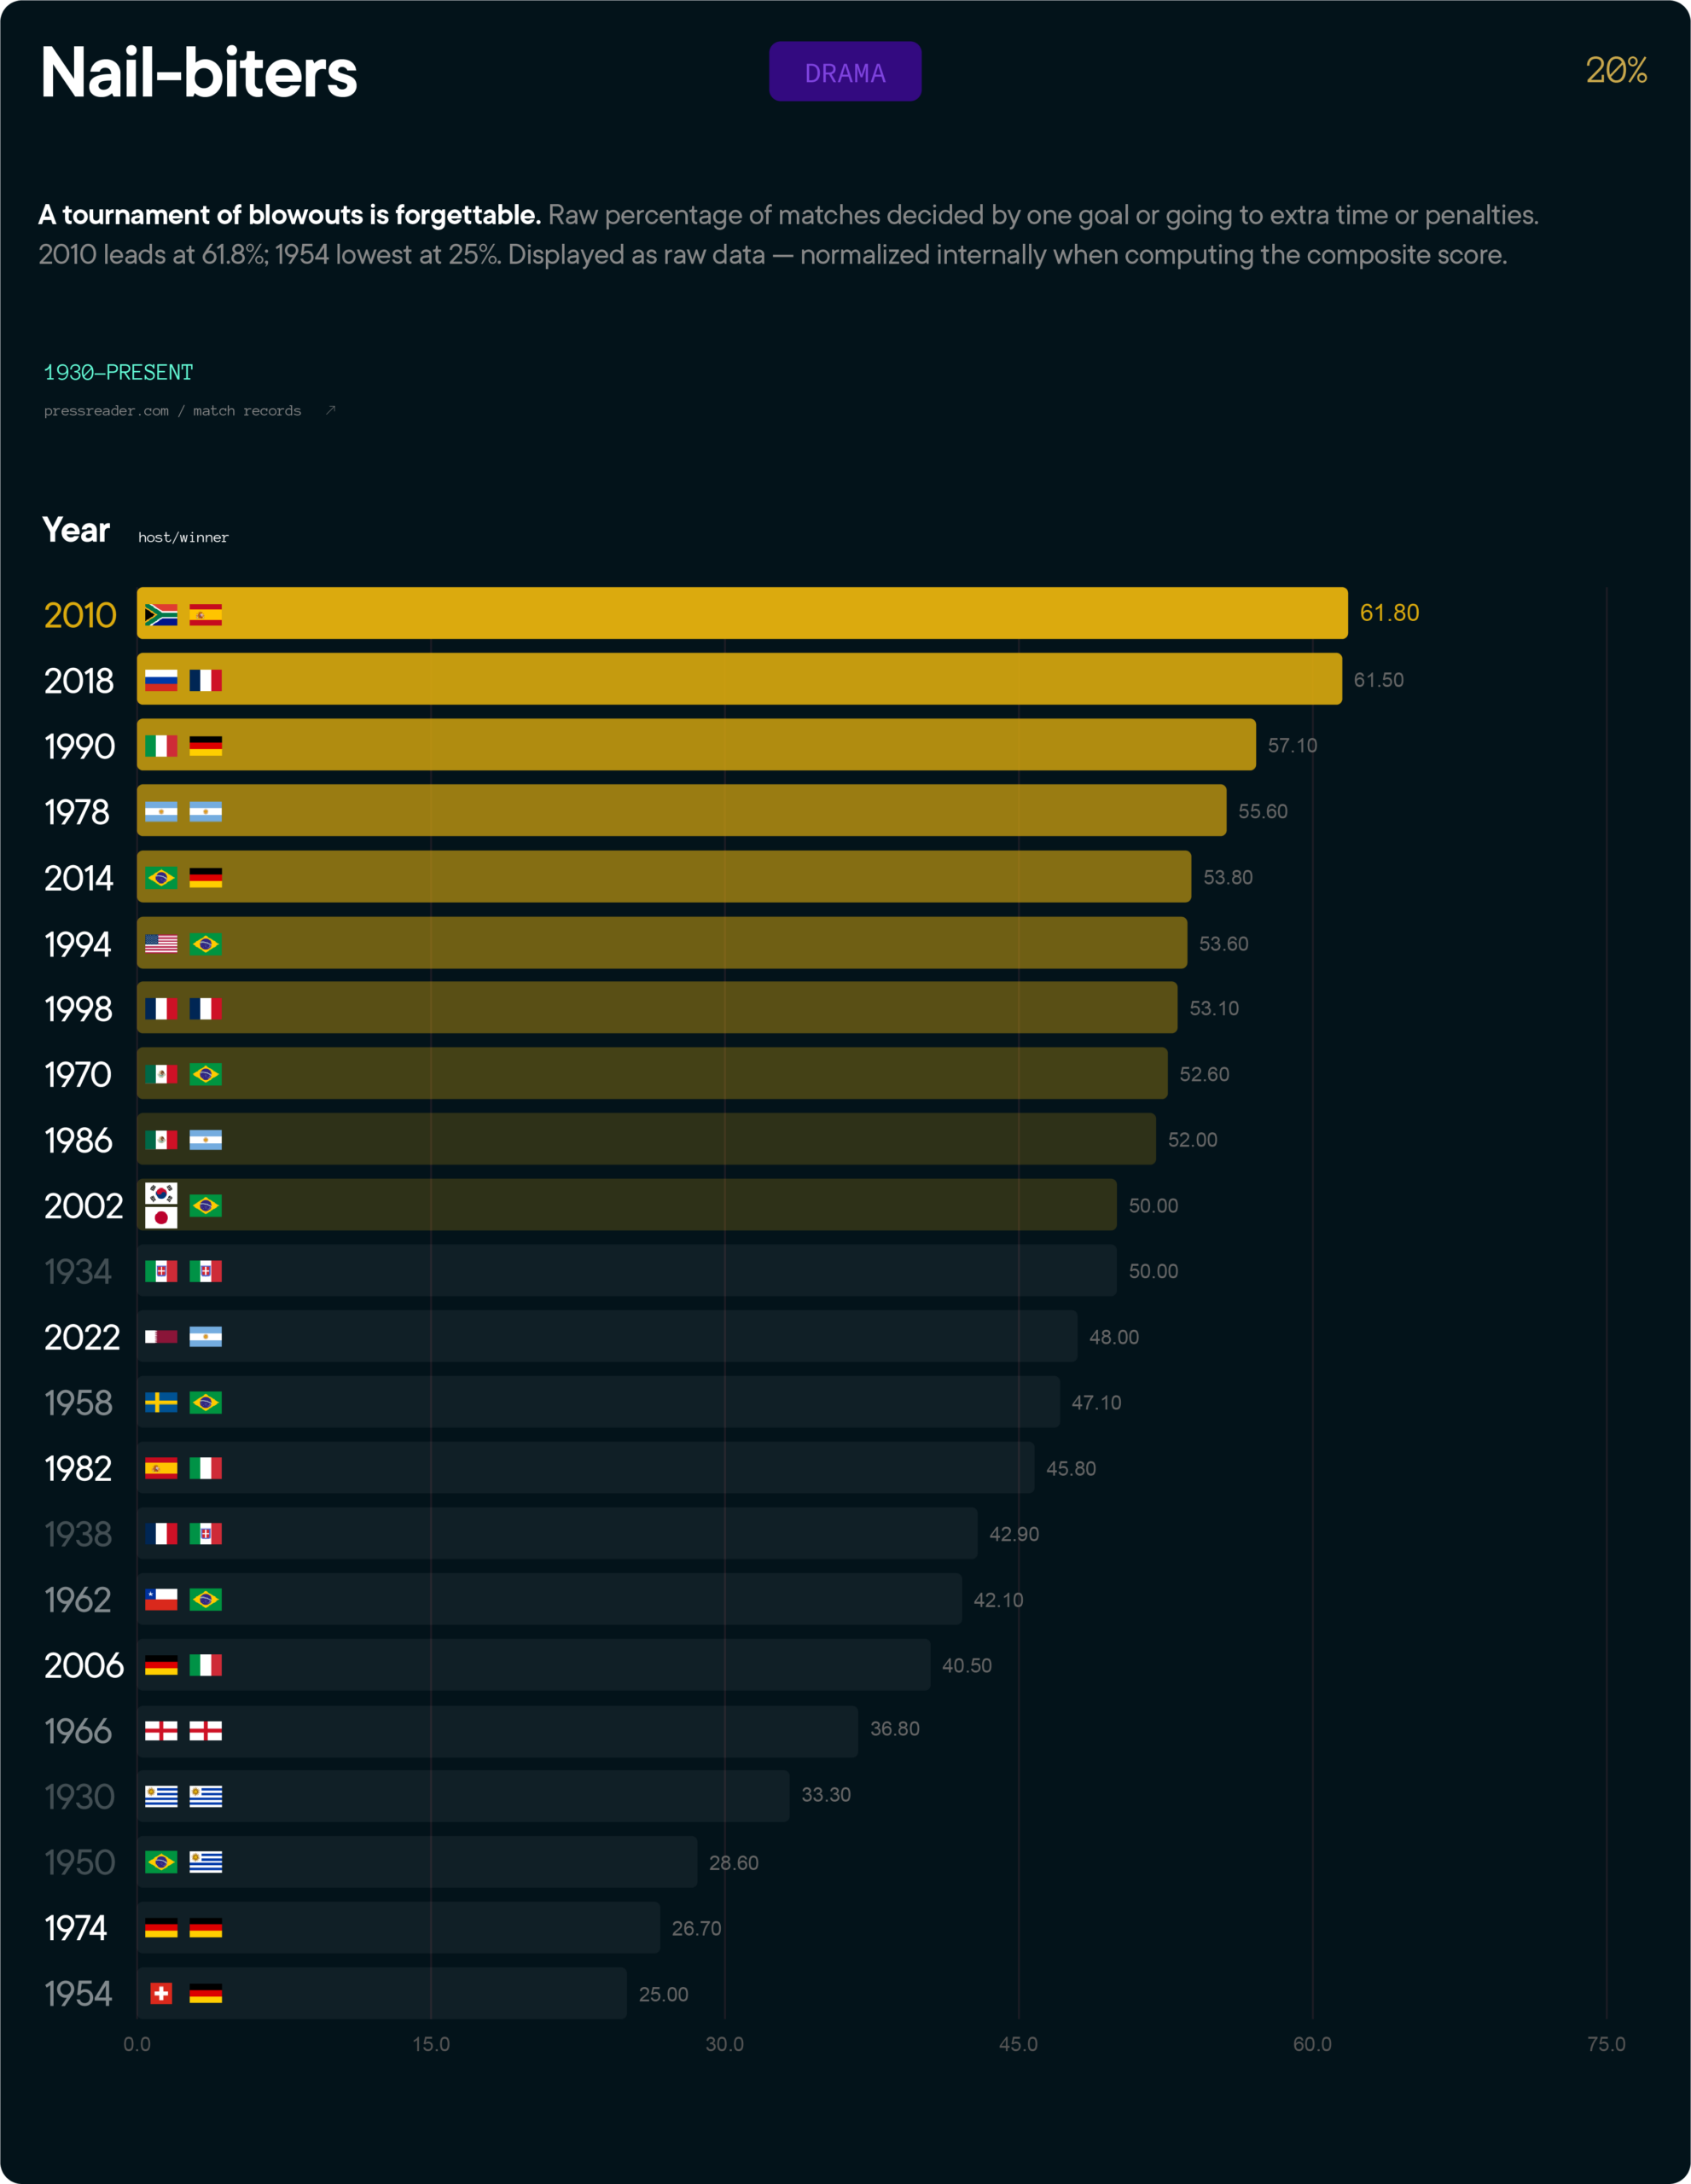
Nail-biters (20%) — A tournament full of 4-0 blowouts is forgettable. A tournament where game after game goes to the wire is one you can’t look away from. The nail-biters metric tracks how many matches genuinely hung in the balance.
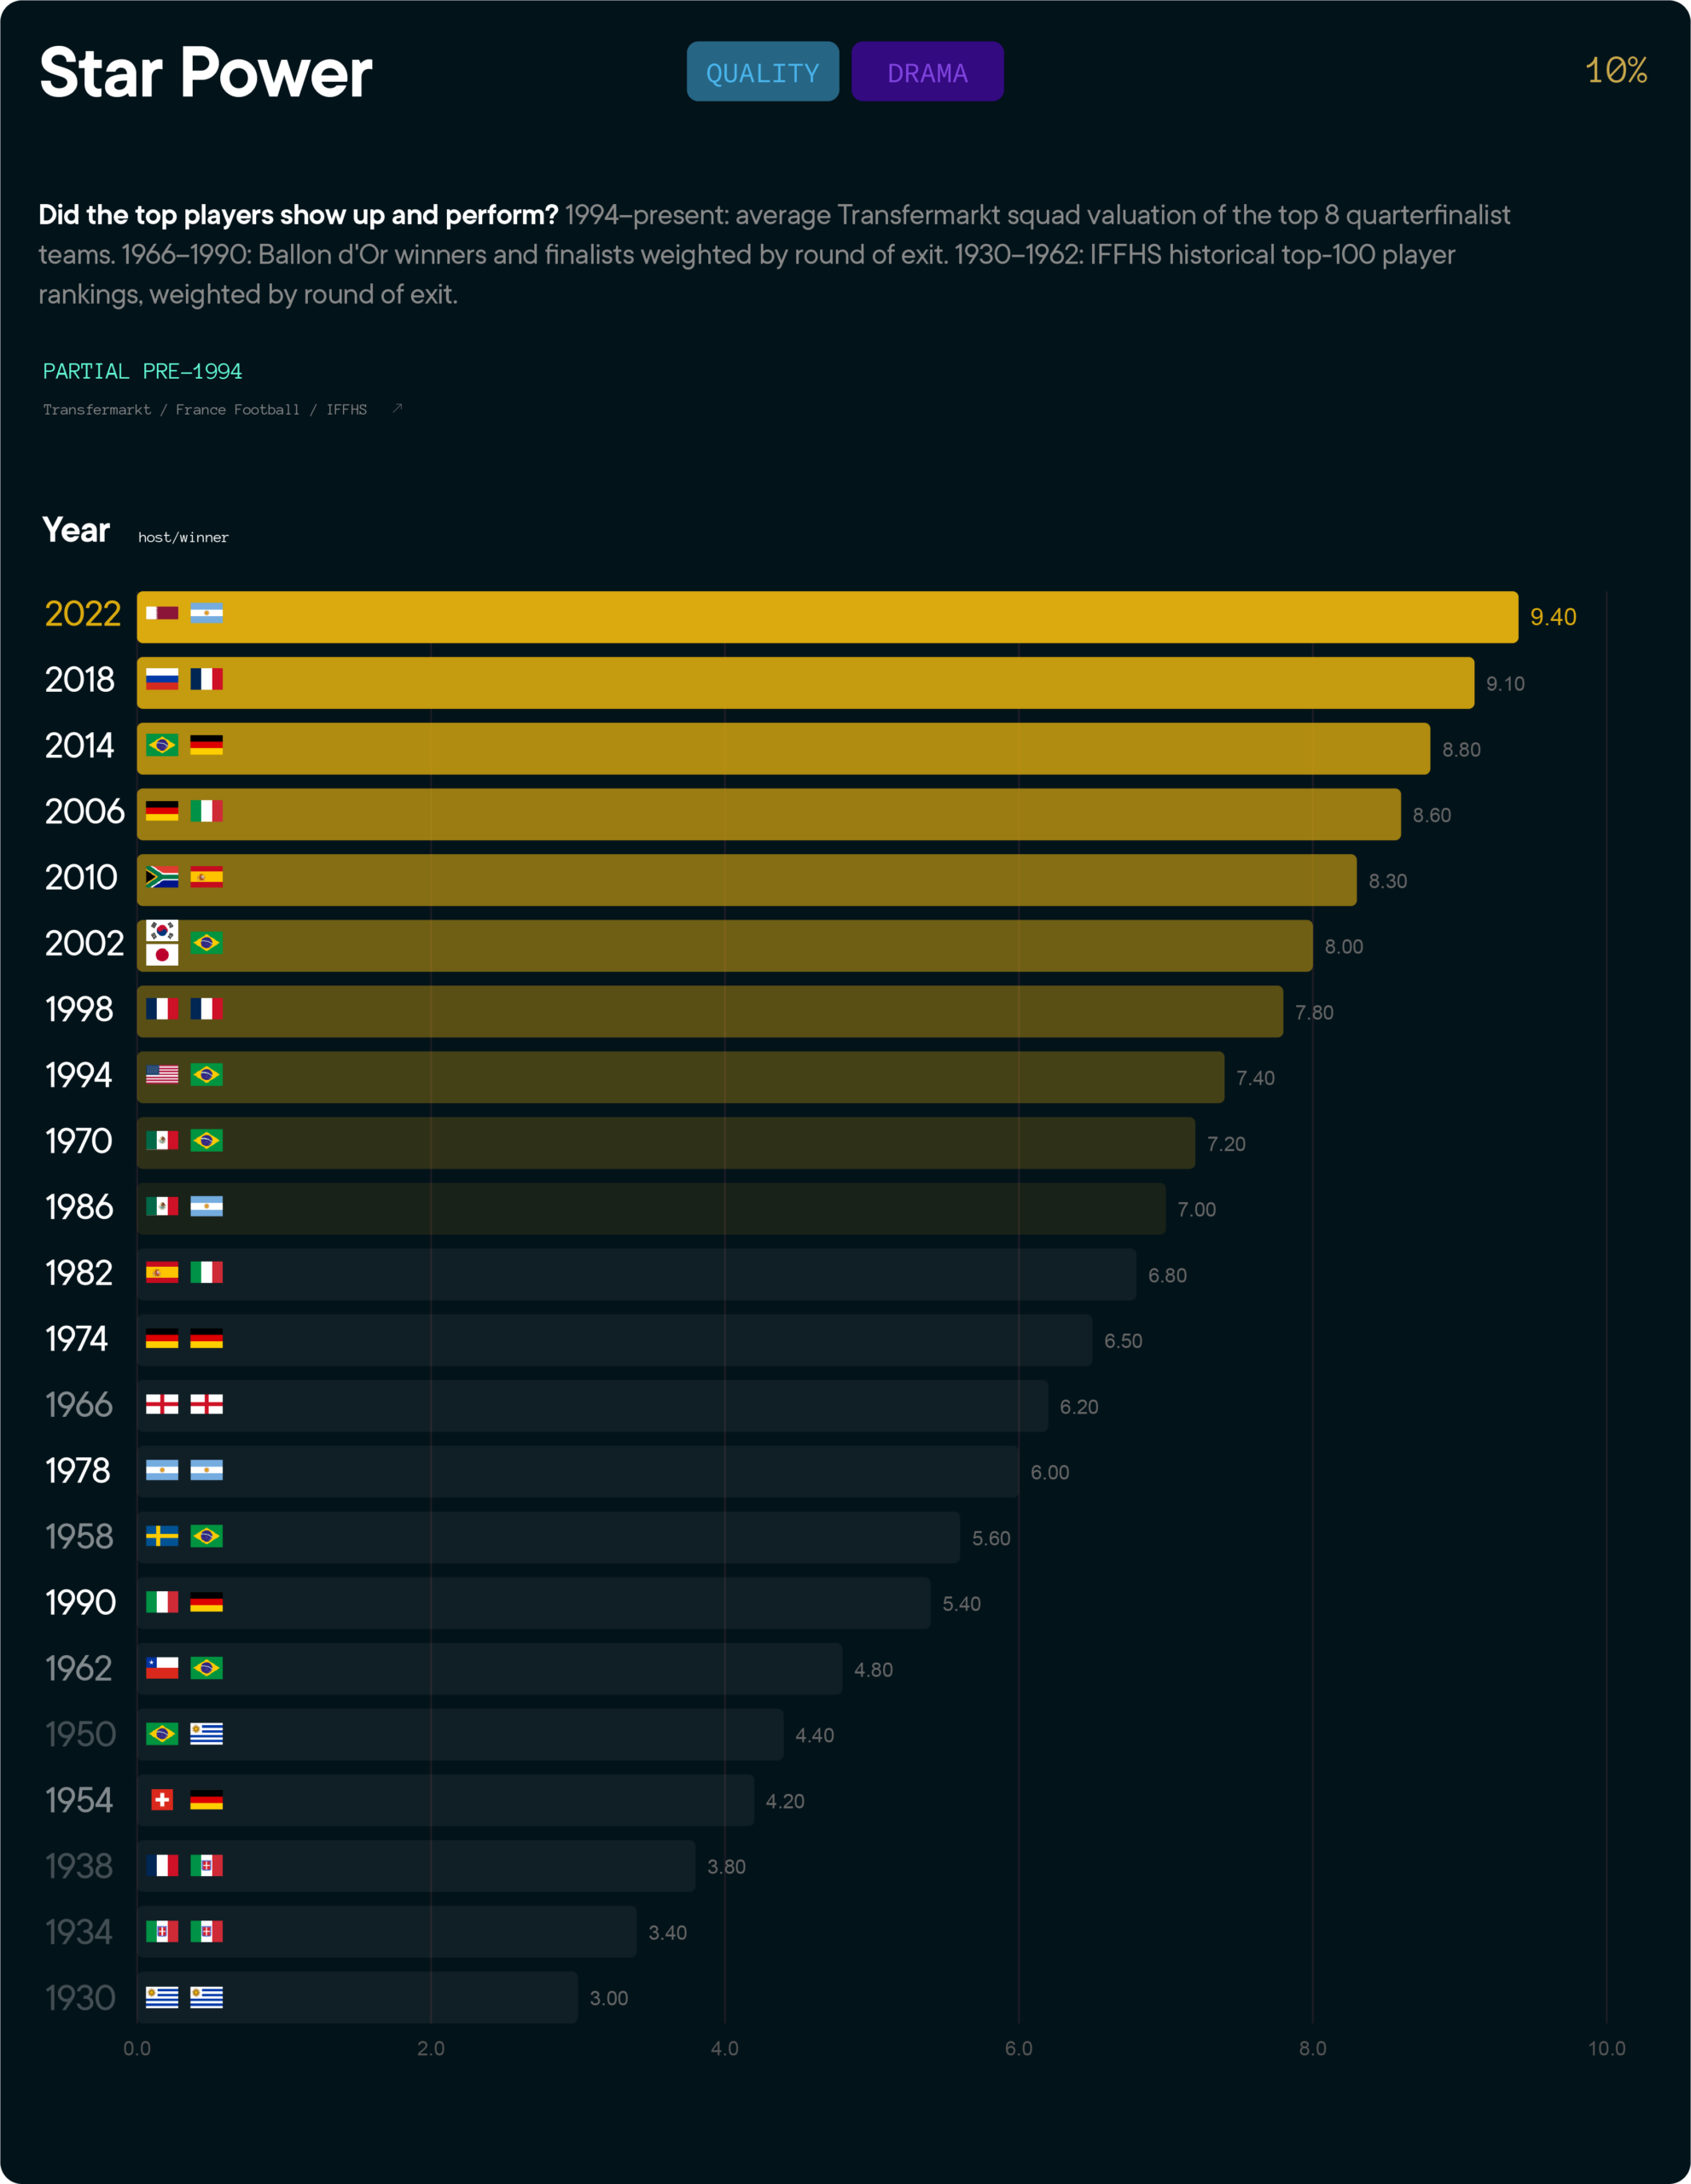
Star Power (15%) — A World Cup where the biggest players in the world are still standing in the quarter-finals feels different from one where they went home in the group stage. We reward tournaments where elite talent made it to the rounds that matter. 1994–present: average Transfermarkt squad value of the top 8 quarterfinalist teams. 1966–1990: Ballon d’Or winners and finalists weighted by round of exit. 1930–1962: IFFHS historical top-100 player rankings, weighted by round of exit.
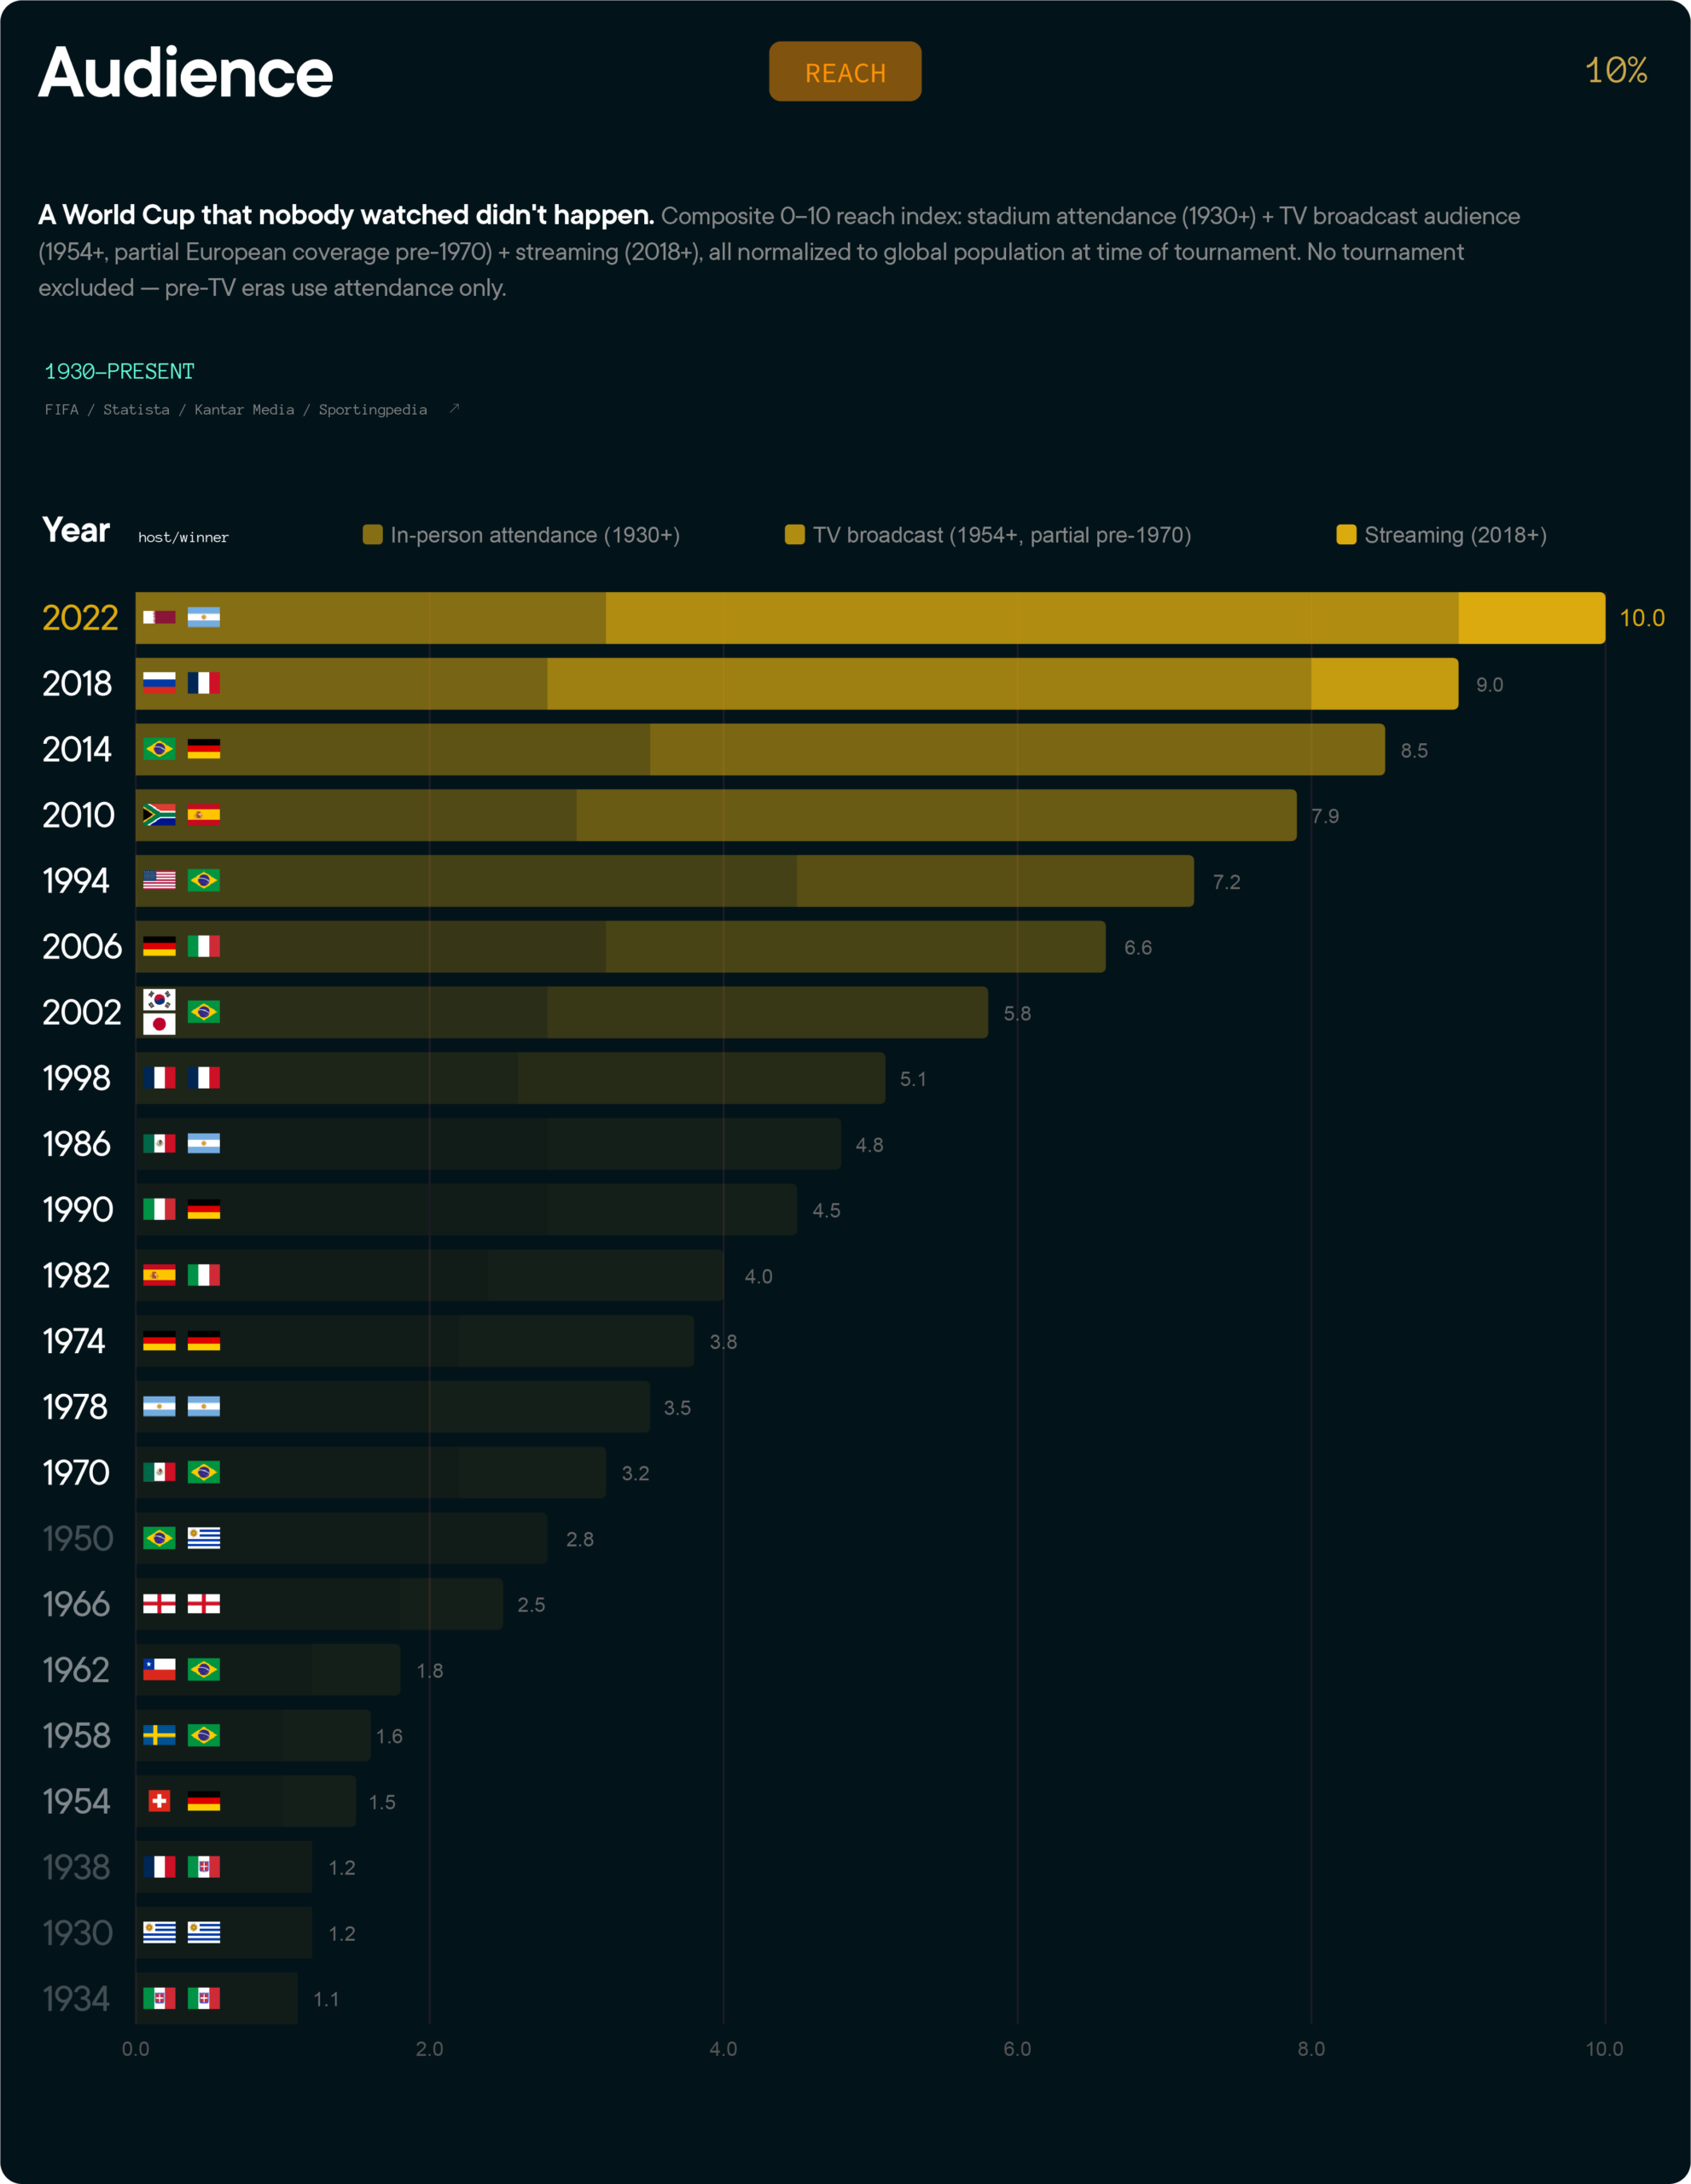
Audience (10%) — A World Cup that nobody watched didn’t happen, as far as the world is concerned. The audience reach metric captures how many people were actually there for it — in the stadium, in front of a television, or on a streaming platform — normalized to the global population at the time so that 1970 and 2022 are fairly compared.
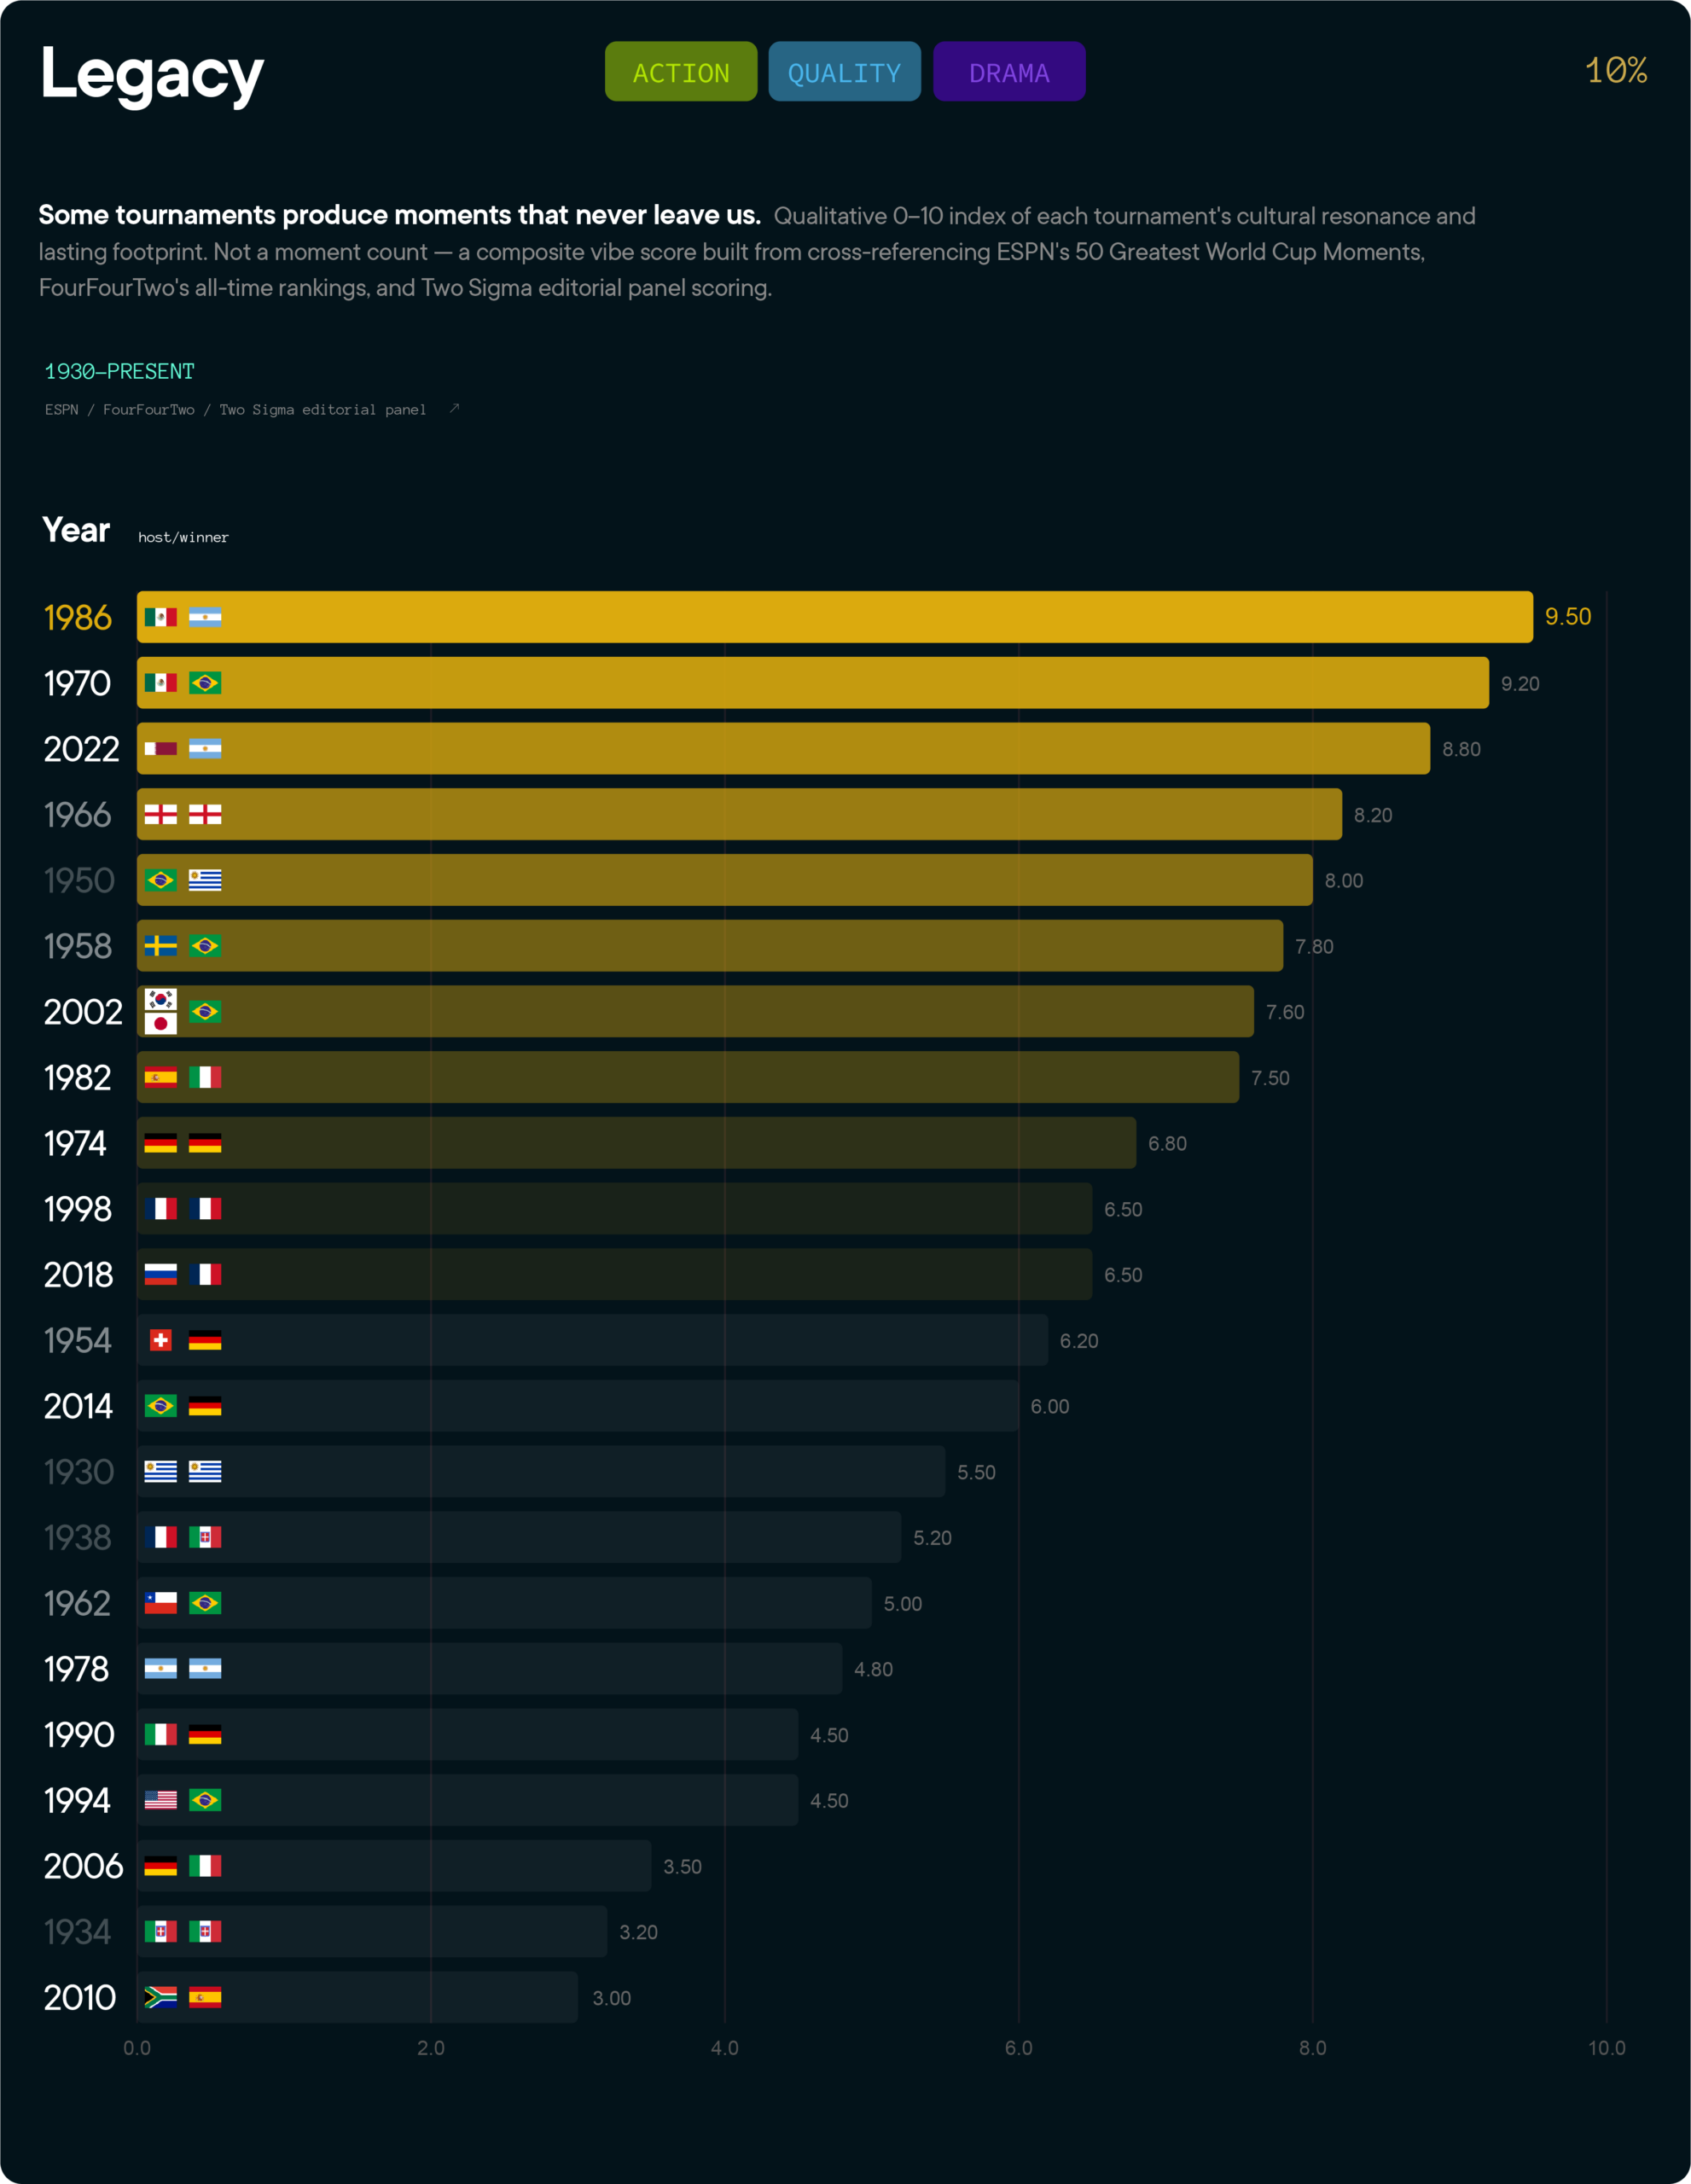
Legacy (15%) — Some tournaments produce moments that never leave us. The Maracanazo. The Hand of God. The 7-1. These aren’t just sporting results — they’re cultural events that people reference decades later whether or not they follow football. The legacy score is our most deliberately qualitative metric: a 1–10 index of each tournament’s lasting cultural footprint.
A note on data integrity: One model applies to all 22 tournaments back to 1930. The audience reach metric uses attendance for pre-TV eras, partial European TV from 1954, global TV from 1970, and streaming from 2018 — normalized throughout so tournaments are directly comparable. The chaos index uses an estimated score pre-1982 (no penalty shootout data). We are, in effect, guessing how chaotic 1954 felt — but we’re guessing rigorously.
What the model tells us (so far)
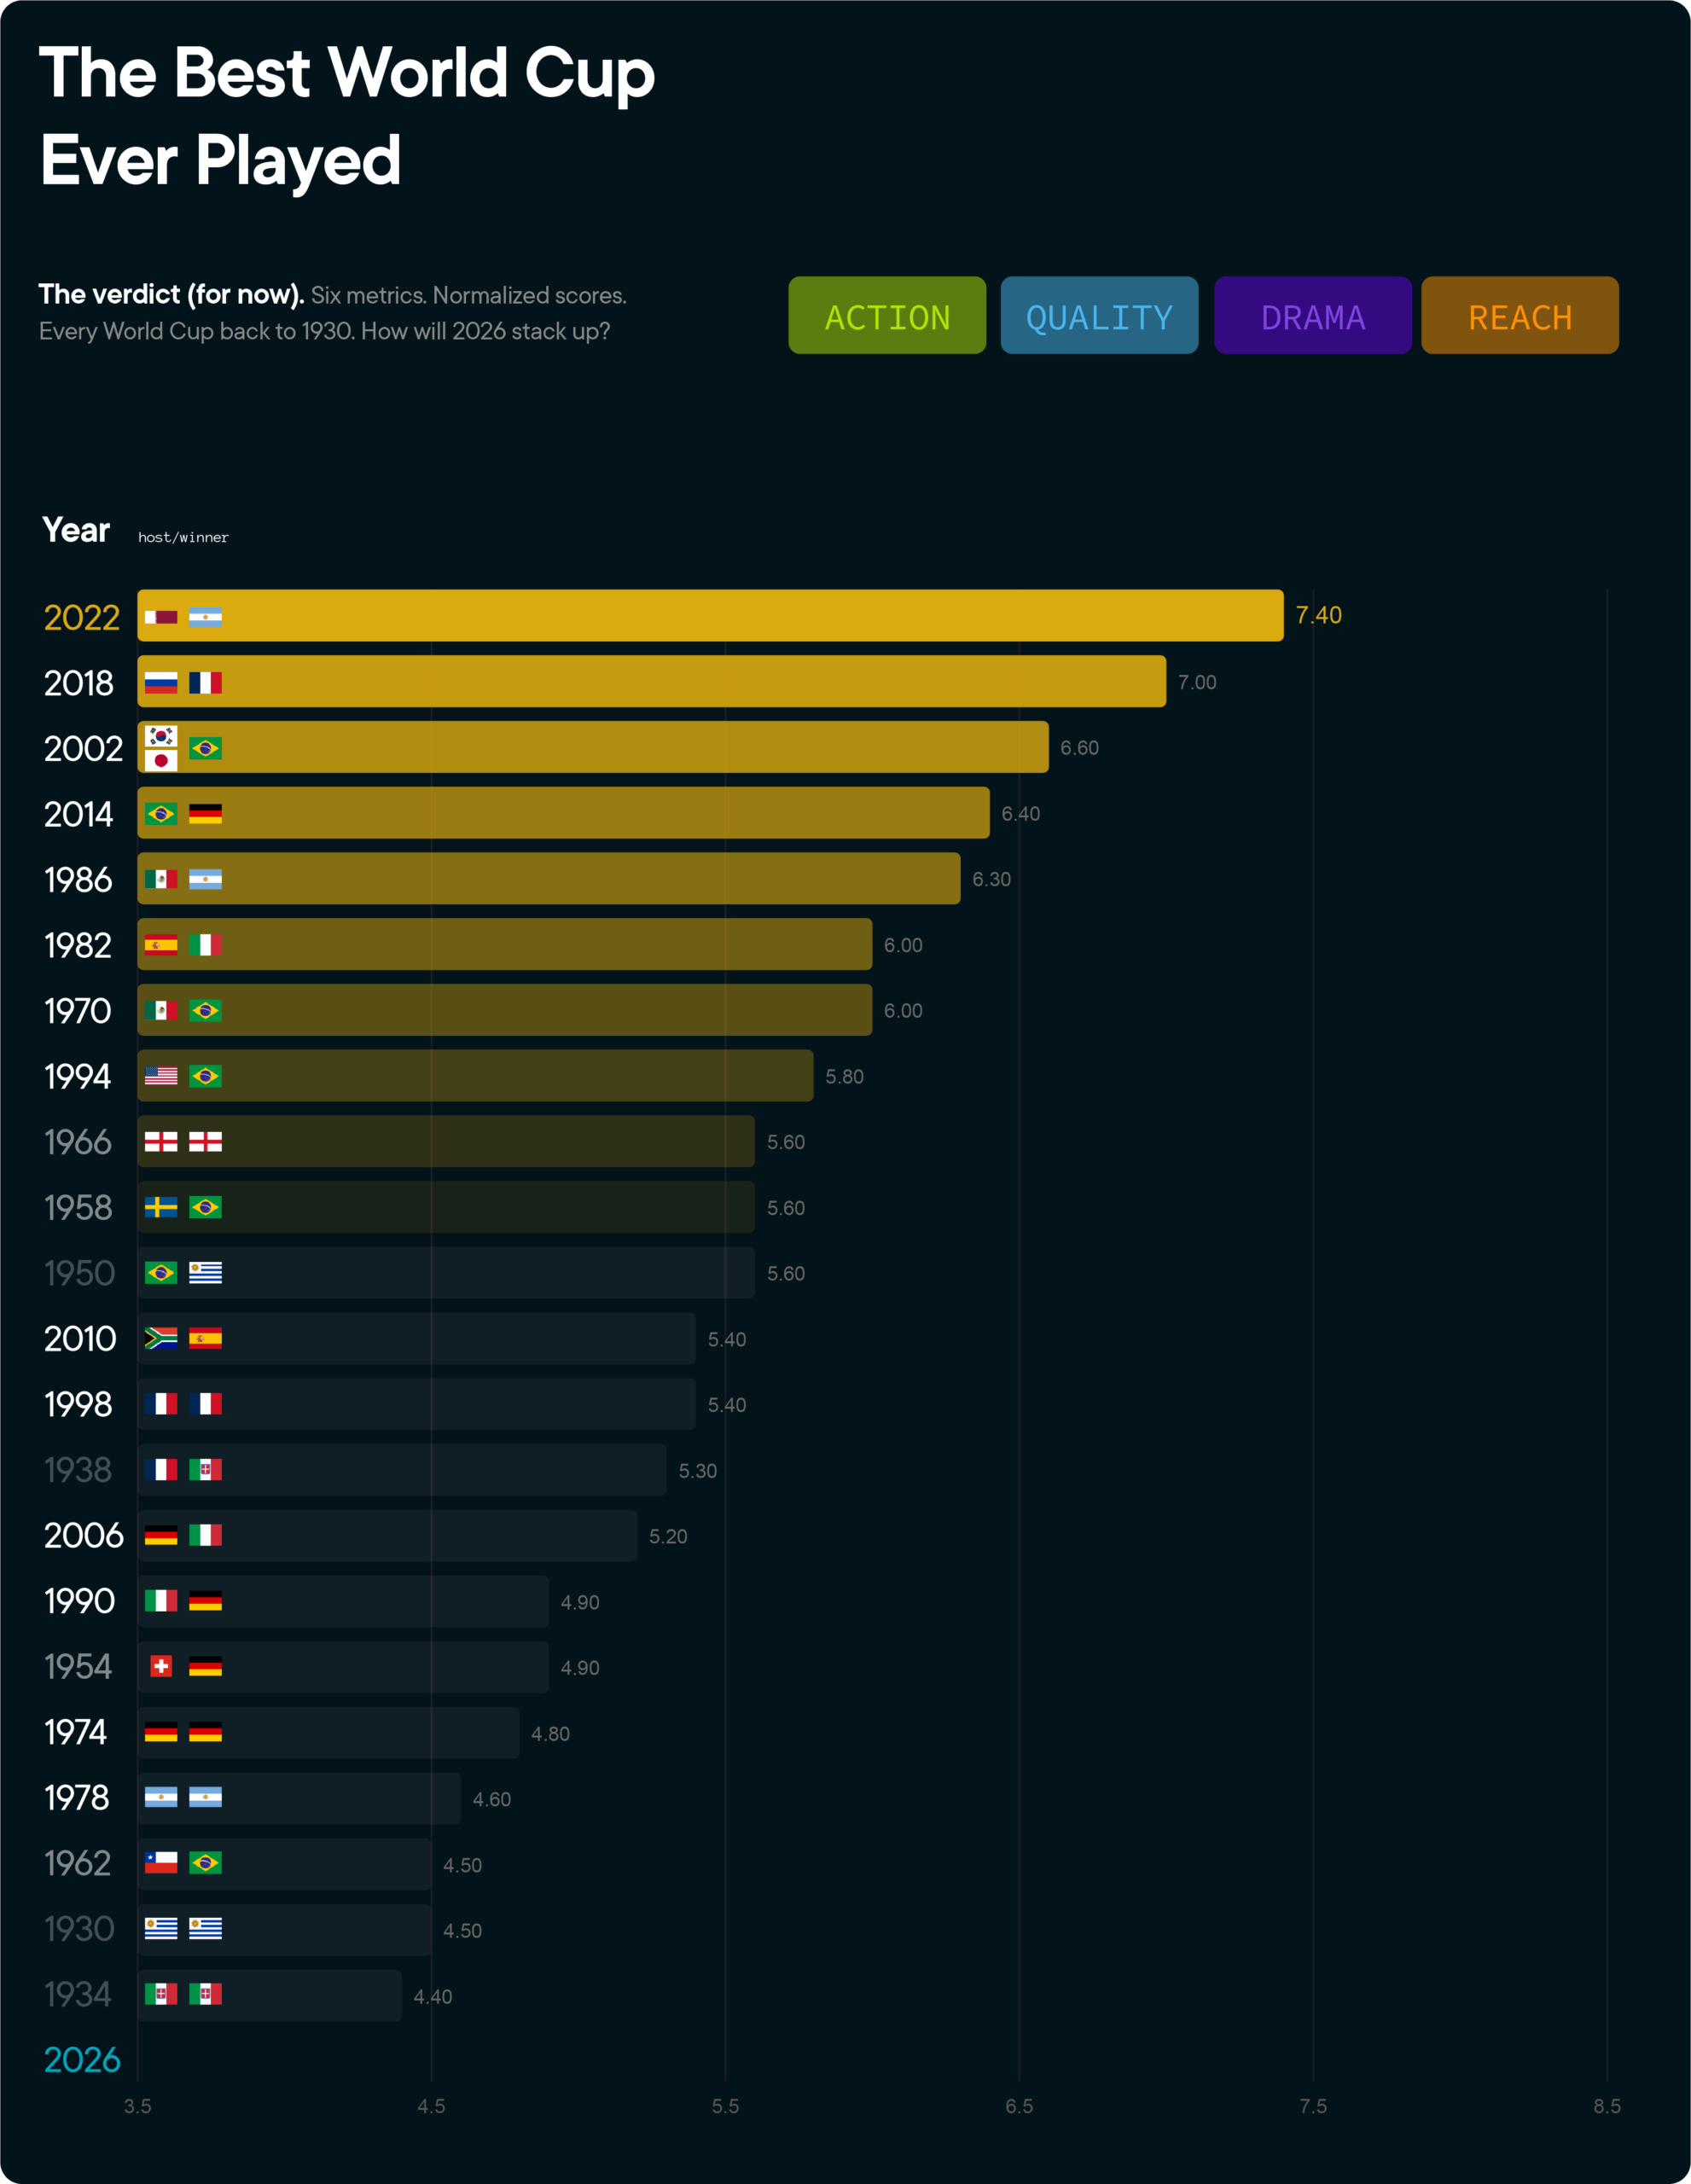
Qatar 2022 tops the model and it isn’t particularly close. The chaos index is the highest of any tournament ever — Saudi Arabia beating Argentina, Germany eliminated in the group stage (again), Morocco becoming the first African nation to reach a semi-final. Five penalty shootouts including the final. Then there’s the final itself: a 3-3 draw after 90 minutes, a hat-trick from Mbappé, Messi lifting the trophy after penalties. The audience reach is a perfect 10. Even if you’re skeptical about Qatar as a host, the football was extraordinary.
The lowest score in our model belongs not to 1990 but to Italia 1934. The football itself was unremarkable and the vibes were deplorable. Referees were widely accused of favouring the hosts under political pressure, and several of the world’s strongest nations, including Uruguay — the reigning champions — boycotted in protest of Mussolini. There were no iconic moments, no breakout stars, no matches that entered cultural memory.
What we’re watching in 2026
The 2026 World Cup is the first with 48 teams. More matches, more potential upsets, more chances for a Cinderella moment. Our model will update after every round. By the final, we’ll have an answer. Not an argument. A number. Follow along each week as we ask the question that matters most: Will this be the best World Cup yet?