Corporate stock buybacks in the US have grown in frequency and size over the past decades, and many market commentators have suggested that the rise in stock buybacks has artificially propped up equity prices, suppressed market volatility, and weakened corporate balance sheets. We test these views by examining US stock buyback announcements data, and find little evidence to support these claims. There is some evidence that share buybacks are announced following a short-term period of stock price declines, which could either represent opportunistic purchasing at an attractive price or an attempt by management to stem the decline. However, on the whole, companies that announce share buybacks appear to have stronger-than-average fundamentals and long-term stock performance exceeding the market, with excess profits and cash flows that could reasonably be returned to shareholders.
1. Introduction
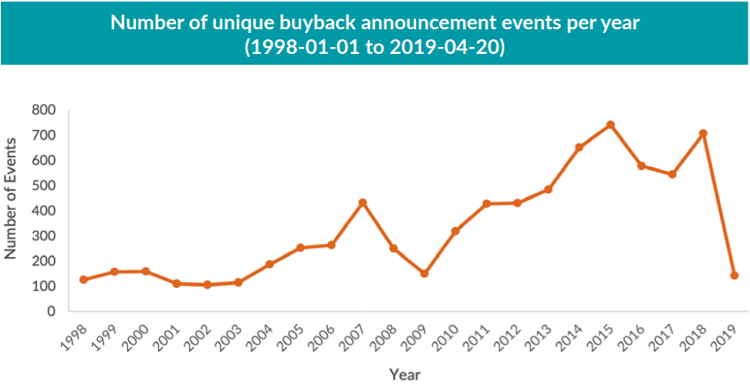
Corporate stock buybacks in the US have grown in frequency and size over the past decades (see Figure 1 below), leading to a host of concerns from market commentators. Among the most frequent concerns are that share purchases may be artificially propping up equity prices, suppressing market volatility, and weakening corporate balance sheets to name a few. In this Street View, we test these views by examining nearly 25 years of US stock buyback announcements, and find little evidence to support the aforementioned concerns.
This Street View is structured as follows:
- Section 2 describes the buyback announcements data that underlies our study.
- Section 3 studies whether poor historical performance of a stock predicts a future buyback announcement. We find that an announcement is more likely if a firm has been performing well over the past one to three years but has suffered a short-term decline. Furthermore, we find that short-term price volatility has little impact on the likelihood of a buyback announcement since the Global Financial Crisis.
- Section 4 examines the average price action leading up to, and following, buyback announcements, and suggests that while a stock generally sells off before a buyback, it doesn’t necessarily recover and start to rally after a buyback is announced, thus, suggesting that buybacks are not propping up prices in the long term. Additionally, our examination of post-announcement share volatility fails to suggest that buybacks suppress market volatility.
- Section 5 looks at the characteristics of the firms that announced a stock buyback and suggests that such companies tend to have stronger fundamentals and lower levels of market-implied risk (as measured by both market beta and idiosyncratic volatility) on average.1 This suggests that buybacks are not used by weak businesses to prop up their stock price.
2. About the Data
We performed our study on Russell 3000 Index constituents2 over a period spanning from Jan 1st, 1998 to Apr 30th, 2019. We used Bloomberg to obtain the list of share buyback announcement dates for these stocks over the period of study. There were a total of 9,698 buyback announcements,3 though accounting for multiple announcements from the same company in the same month resulted in 7,327 unique buyback events.
We base all the results presented in sections 3 and 4 on idiosyncratic returns to the Russell 3000 constituents relative to a CAPM-style risk model (i.e., after adjusting for the estimated market beta of each stock). 4
3. Do Buybacks Follow Selloffs?
We start by investigating the claim that companies tend to announce buybacks when their stock prices are declining or amid rising volatility, potentially as an attempt by management to support prices and/or reduce stock volatility. To test how past stock performance may affect the probability of a buyback announcement in the subsequent month, we use a logistic regression model5 to estimate the probability of a firm announcing a share buyback in the next month conditional on two measures of trailing performance:6
- Historical Sharpe ratio: annualized Sharpe ratio of a stock’s idiosyncratic monthly returns over the preceding h months, to see if positive or negative returns over different lookback periods are predictive of buyback announcements.
- Ratio of short-term to long-term volatility: ratio of a stock’s realized daily idiosyncratic volatility over the previous month divided by its realized daily idiosyncratic volatility over the previous h months, to see if short-term increases or declines in stock-specific volatility are predictive.
We split our analysis into two discrete periods: before and after the Global Financial Crisis,7 as we found notable differences in their results. To account for time-varying dispersion in the returns and volatilities of individual stocks, we also transform the historical Sharpe ratios and volatility ratios for all 3,000 stocks within each calendar month into cross-sectional z-scores before fitting the logistic regressions over all stock-month observations in each period.
The table below shows the z-scores quantifying the statistical significance of the dependence of the likelihood of a stock buyback announcement on the two measures of past performance we described above. A score with an absolute value greater than 2.0 roughly denotes a statistically significant relationship. A positive (negative) value of the score implies that the higher the value of the predictor, the higher (lower) the likelihood of a buyback announcement in the next month.
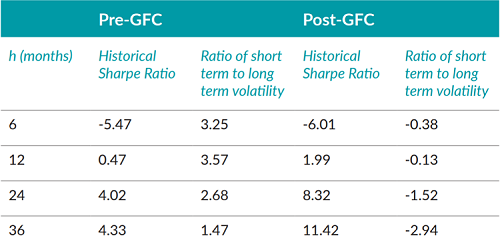
A handful of key results from Table 1 deserve highlighting:
- The z-scores for historical Sharpe ratio in both analyzed periods are strongly negative over a six-month lookback horizon and strongly positive over longer lookback horizons, implying that companies announcing buybacks tend to have strong long-term performance relative to the market but tend to announce after a recent sell-off.
- Recent increases in volatility appear much less predictive of a stock buyback announcement than the returns relative to the market, and the predictive direction for the post-GFC period is even in the opposite direction from what we would expect (stocks with declining short-term volatility are somewhat more likely to announce a buyback after controlling for historical Sharpe ratio).
- The tendency for strong 2- and 3-year returns versus the market to positively predict a share buyback announcement grew significantly stronger in the post-GFC period, even after accounting for the larger number of observations in this period.
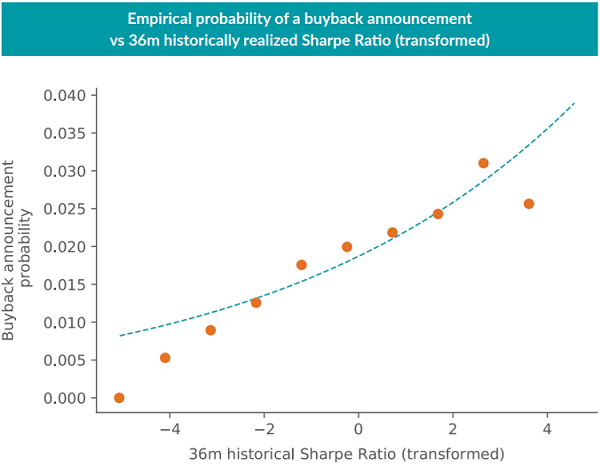
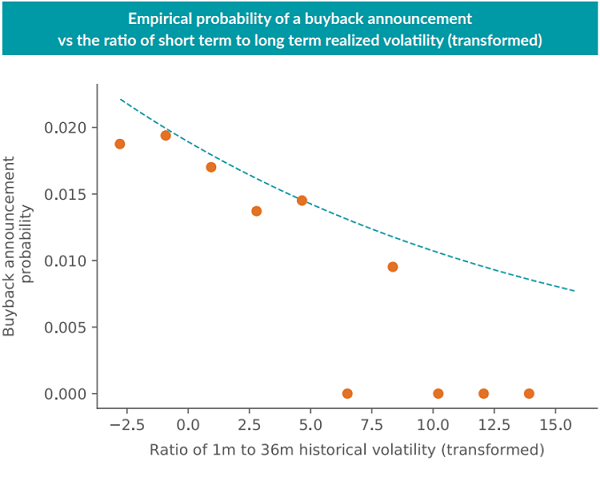
We can check the robustness of these regression results by also looking at the empirical frequency of buyback announcements for stock-month observations with historical Sharpe ratio or volatility ratio z-scores falling into particular narrow ranges, and plotting those empirical frequencies against the estimated probability from our logistic regression. Figure 2 shows these plots for the post-GFC period with a 36-month lookback window for both stock performance metrics. Again, there are a handful of results to highlight:
- Buybacks are a relatively infrequent occurrence in the dataset, with the average stock having a 1.9% chance of announcing a buyback in any given month.
- The empirical fit of the logistic regressions looks quite good overall, except for the more extreme performance z-scores, where there are considerably fewer observations.
- Firms with extremely low long-term returns relative to the market appear even less likely to announce a share buyback than the fitted logistic curve would suggest.
- Firms with sharply increasing idiosyncratic volatility appear even less likely to announce a share buyback than the fitted logistic curve would suggest.
More broadly, these results suggest that buybacks tend to come from firms with strong long-term performance whose share prices had recently hit a rough patch, but without much rise in volatility. This provides some support for the hypothesis that management tends to opportunistically announce buybacks when shares appear undervalued, or as a short-term price support.8
The post-GFC data especially does not support the hypothesis that share buybacks have been suppressing broader market volatility, as buybacks tend to be announced more often by firms with level or declining volatility compared to history. However, this finding does not rule out the counterfactual possibility that firms announcing buybacks avoided a rise in share price volatility that would have otherwise occurred. To investigate the potential impact of share buybacks on the broader market’s returns and volatility, we now turn to analyzing the average impact on share prices before and after the announcement.
4. Expected Price Action around Buyback Announcements
By performing an event time study, we estimated the cumulative average abnormal returns (CAAR) in excess of the market earned by Russell 3000 Index constituents that announce a share buyback over the period immediately preceding and following the announcement month. Our results, in Figure 3, suggest that while a typical buyback announcer is selling off in the six months leading up to the buyback announcement (as shown in the previous section), the post-announcement recovery is relatively weak.
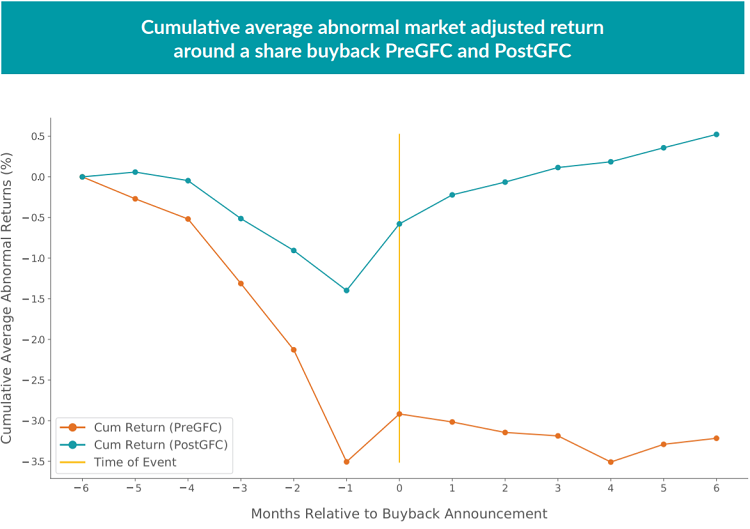
Leading up to the buyback announcement, the average announcer’s share price has been selling off, with noticeably larger negative CAAR for the pre-GFC period than post-GFC. This squares with the logistic regression results in Table 1: both periods show that buybacks tend to be more likely following a six-month period with a negative idiosyncratic returns Sharpe ratio, but the pre-GFC period also shows buybacks tend to follow rising idiosyncratic volatility, while there is no such effect in the post-GFC period. As the historical Sharpe ratio measure used in this study divides the average idiosyncratic returns by the idiosyncratic volatility, the larger denominator (from rising volatility) in the pre-GFC period suggests we should also see more strongly negative returns in the numerator.
The announcement month itself shows a positive market response, with roughly 0.5-0.75% average excess returns in both the pre- and post-GFC datasets.9 Here, the results from the two periods diverge again, as buyback announcers do not recover any further on average over the pre-GFC period, while the postGFC period shows an average recovery roughly to the pre-selloff level. Although the total trough-to-peak recovery for buyback announcers in the post-GFC period appears strongly statistically significant,10 the total CAAR from the beginning of the sell-off to six months after the announcement is less than 0.5% and not statistically significant.11 While the buyback announcement does appear to provide share price support in the more recent dataset, the recovery to pre-selloff levels suggests that buybacks on average do not appear to lead to “artificially” elevated valuations.12
Figure 3 implies a stark difference in the recovery of a stock’s price after a share buyback announcement across the pre and post GFC periods. This could point to the possibility of markets becoming more efficient in pricing a buyback announcement over recent years that now leads to quicker price recovery than what is observed pre GFC. Many other possibilities exist, such as a significant change in financial regulation post GFC, changes in market structure due to an increased flow of capital into quantitative trading strategies, and etc. This difference is an interesting question in itself and we defer its investigation to a future Street View.
We now turn to the effects on share price volatility, with Figure 4 presenting the average daily idiosyncratic volatility of a buyback announcer over the twelve months preceding and following the announcement month. As suggested by the regression results in Section 3, the pre-GFC period shows a rise in short-term volatility in the months leading up to the buyback announcement, while this effect is much less clear in the post-GFC data. Volatility spikes in the announcement month for both periods as the market digests the news, with a positive average outcome as seen in Figure 3.
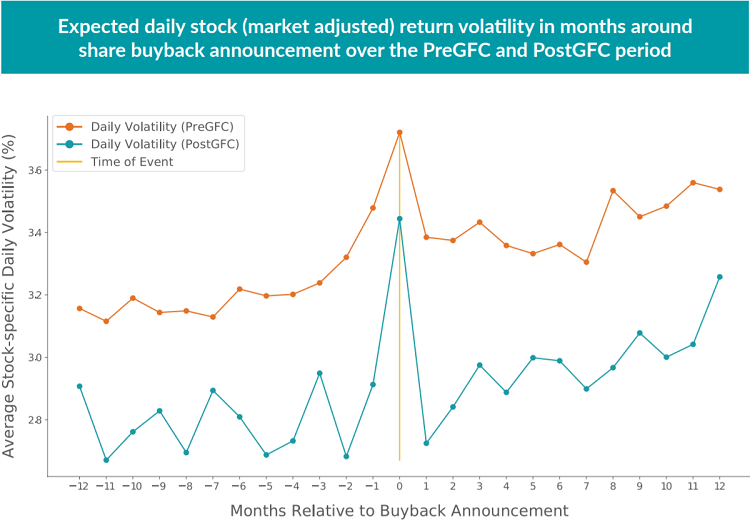
However, share price volatility is not suppressed after a buyback is announced. In fact, the average level of idiosyncratic volatility post-announcement is slightly higher than the preannouncement volatility in both the pre- and post-GFC periods.13 We note that this effect is actually in the direction that a simple corporate finance model would suggest, as a share buyback should increase the leverage of a company’s equity while leaving the underlying business risk unchanged, thus boosting the expected equity volatility.
5. Characteristics of Stocks That Announce Buybacks
Finally, we want to take a deeper look at the fundamental characteristics of companies that announce share buybacks versus the broader market, to see if the data supports beliefs that companies are significantly weakening their balance sheets or foregoing worthwhile investment to return capital. To test for significant differences between firms announcing a buyback and the average Russell 3000 firm, we used the style factor definitions from MSCI Barra’s most recent US risk model: the US Total Market Equity Trading Model. These style factor exposures per stock provide point-in-time scores for how each individual stock compares to the rest of the US market on a large number of dimensions, including technical factors such as momentum, beta, and residual volatility; fundamental factors such as firm profitability, earnings quality (mostly driven by cash earnings being in line with accounting earnings), and leverage; and measures combining market prices and fundamentals such as valuation metrics and market capitalization.
We investigated which characteristics most strongly differentiated buyback announcers from the rest of the market by comparing the distribution of scores (or loadings) on each style factor for stocks on the day before their buyback announcements to the loadings of all the stocks in our study. We performed a difference-of-means test between the two distributions to determine which style factor loadings showed statistically significant differences from the market as a whole, and the results of this analysis for the factors with the most significant differences between the buyback announcers and the broad market are presented in Figure 5 below.
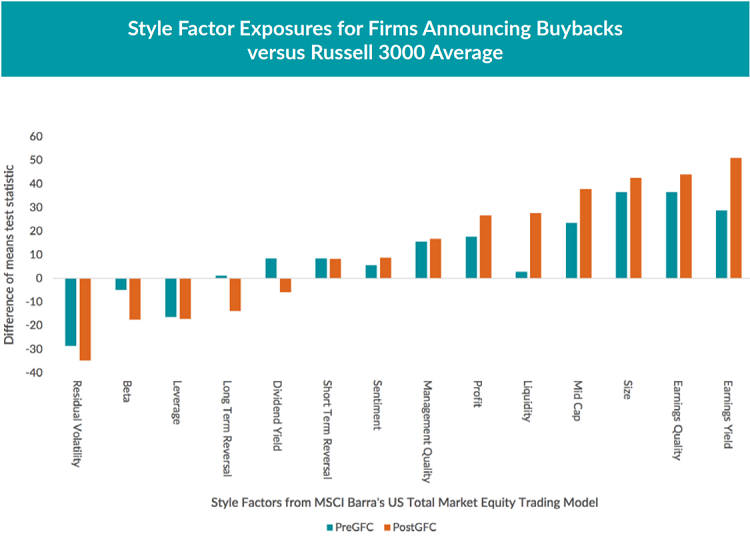
Stocks announcing a share buyback tend to have significantly stronger fundamentals than average, with higher scores on Earnings Yield (i.e., lower price-to-earnings ratio), Earnings Quality (i.e., more cash earnings), and Profitability (i.e., higher return on equity and return on assets). These firms also tend to be larger (positive Size and Mid-Cap loadings), with lower Leverage and lower market-implied risk (both lower Beta and lower Residual Volatility).
These results suggest that corporations buying back stock are exactly those with the greatest ability to return cash to shareholders while still supporting future growth, and provide little evidence that the firms are endangering themselves through excess leverage to fund the capital returns.
6. Conclusion
Contrary to the worst claims about share buybacks, we find little evidence from our large-scale study of individual buyback announcements that they are artificially suppressing market volatility or requiring companies to forgo otherwise profitable investments or take on excess leverage. There is some evidence that share buybacks are announced following a short-term period of stock price declines, which could either represent opportunistic purchasing at an attractive price or an attempt by management to stem the decline.14 However, on the whole, companies that announce share buybacks appear to have stronger-than-average fundamentals and long-term stock performance exceeding the market, with excess profits and cash flows that could reasonably be returned to shareholders.
Our study points towards a noticeable difference in the extent of post buyback announcement price recovery across the pre and post GFC periods. One could think of a few a priori explanations for this difference (that we mention in Section 4); we pose this as an open question to the wider Financial Economics research community and plan to revisit this topic in a future Street View.