
With scars still raw from the World War I, then Senator and candidate for the 1920 U.S. Presidential election Warren Harding promised a “return to normalcy.” Asset allocators today might empathize, and not just because they need to interpret politicians prone to malapropisms.
During the Great Recession and subsequent interventions by policy makers, high asset return correlations limited options for diversification. Allocators scarred by these conditions might find solace in data showing that the markets “returned to normalcy,” at least along one dimension important to asset allocators. Specifically, the long term co-movements of most assets, both within and across asset classes, have fallen to pre-2008 levels. This decline has accelerated during the past six months.
While most allocators will not forget the lessons they learned from recent years, they may not need to continue to run their portfolio on war footing or accept excuses from managers citing unusual global forces for performance.
Long term, pairwise correlations within asset classes have fallen
Soldiers in the trenches along the Western front during World War I may have felt like they had nowhere to run. Investors, particularly those heavily exposed to equity markets, may have felt a milder but similar sensation, particularly 2008-2013. Figure 1 depicts the challenge.
Using a sample of monthly returns for 74 securities—42 country equity indices, 16 government sovereign bond with ten-year maturity, nine currencies, and seven commodities—Figure 1 plots five-year rolling correlations within an asset class (see appendix in the pdf version of this article for a list of instruments). To ensure a consistent set of instruments, the time series data starts in 1995 and the plot begins in 2000.
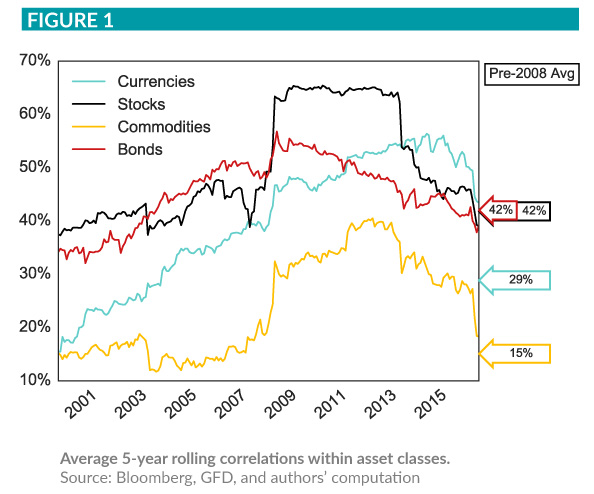
For all four asset classes, correlations spiked at the onset of the financial crisis in late-2008 after a decade of relative stability. Pairwise equity correlations reached nearly 70 percent from a pre-crisis level of approximately 40 percent. Equity correlations plateaued near this elevated level for more than five years. The shape of the line plot for commodities appears similar, although the max correlation peaked at a lower level (approximately 35 percent). Currency and sovereign bond correlations also rose in 2008, though bond correlations slowly declined following the initial spike.
More interestingly, pairwise correlations for all four asset classes have fallen an average of 6.2 percentage points during the past six months. Despite this fall, the rolling five-year level of two out of the four asset classes have correlations above their pre-2008 means, perhaps reflecting the continued, outsize role that central banks play in many economies.1
Long term, co-movement across asset classes has also fallen
The story appears similar across asset classes. Since differing signs (e.g., negative correlation between equity and bonds) might confound a pairwise correlation analysis, Figure 2 plots the percent of return variability explained by the first three principal components (PCs) obtained from a Principal Component Analysis (PCA).
As above, the results use a rolling five-year window for 74 securities across the same four asset classes. Each PC represents a statistical risk factor that can explain part of the co-movement across securities.
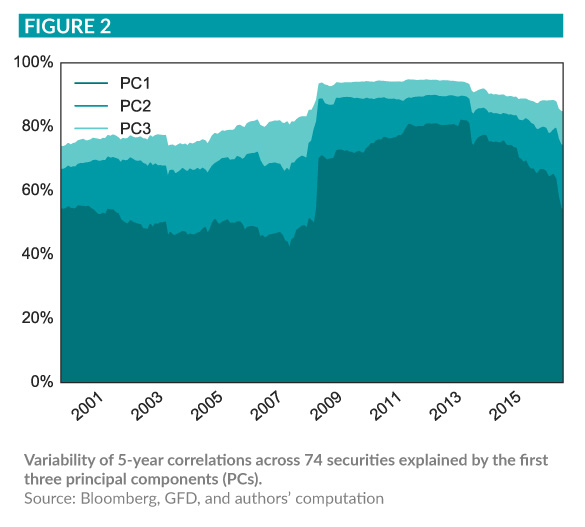
The explained variability of the first three PCs appears relatively stable prior to 2008, with the first PC accounting for an average of 50 percent of the correlations. While these PCs represent statistical instead of economic or intuitive factors, the first PC has a common interpretation. Since almost all securities have a positive loading on the first PC, this factor appears consistent with global economic growth relative to expectations.2 Interpretations of the second and third PCs appear less obvious.
Similar to the pairwise correlations, evidence that the 2008 financial crisis increased global commonality appears clear from the large spike in Figure 2 at the end of that year, when the explained variability of the first PC jumped by approximately 20 percentage points. At the end of 2008, the first three PCs (in sum) accounted for nearly 90 percent of the variation. In plainer language, only three factors explained nearly all of the co-movement across major liquid asset classes during the most tumultuous part of the financial crisis.
More recently, the percent of variability explained by the first PC has fallen by about 10 percentage points over the past six months, to a level slightly above to its pre-2008 average. The second and third PCs pick up some of that loss, but, on net, the co-movement across asset classes has fallen. The trend (particularly for the first PC) also appears favorable for asset allocators hoping to find greater variability and therefore greater diversification across asset classes.
Enjoy the relatively normal times while they last
The causes of changes in intra- and inter-asset class comovement remain an open question,3 but its existence raises a few important considerations for asset allocators. First and most obviously, some managers attributed their portfolio’s performance to the lingering effects of the financial crisis. That excuse appears increasingly thin.
Second, making asset allocation decisions with a risk framework (empirical or otherwise) that includes the financial crisis will likely appear very different from decisions utilizing a risk framework that excludes the crisis. It is not obvious that assuming and naively applying a “longer time series is better” mentality will generate a more accurate forecast. The scars from the Great Recession might offer useful lessons, but those scars might also scare allocators away from taking (hopefully) compensated risks to achieve their objectives.
Third, allocators might take care to constantly update their risk framework. Correlations change during good times and bad. President Harding’s “return to normalcy” did not last long. As students of economic history may recall, the U.S. economy fell into a deep depression from 1920-1921 and then an even deeper depression less than a decade later. The years in between appeared more “roaring” than normal. For an allocator, it might prove better to constantly update a risk forecast than hope that the normal times last.
Finally, if the elevated commonality is the result of financial markets and economies becoming structurally more integrated, realizing the benefits of diversification may prove difficult for investors. While this challenge becomes especially acute during crisis periods, when diversification feels especially important, it tends to persist for several years after the crisis and induce allocators to long for the normal old days.