
“Data! Data! Data! I can’t make bricks without clay!” Sherlock Holmes exclaims in The Adventure of the Copper Beeches. The famed sleuth knew the value of data in solving mysteries, but even he might struggle to piece together a coherent narrative from the confusing data about the current state of the US labor market.
Two recent announcements highlight this challenge.
- The US Census Bureau revealed on September 13, 2016, that median income grew a robust 5.2 percent during 2015. Bucking the long-term trend, US workers at the 20th percentile of the distribution enjoyed faster income growth (6.3 percent) than those at the 80th percentile (4.1 percent).1
- In contrast, the Fed’s September 2016 Beige Book describes “moderate” payroll growth and wage pressure with “rapid gains” applying only to the “specialized skill sets” typically found at the upper end of the income distribution.2
Holmes might try to solve this mystery by searching for more evidence. The US Office of Foreign Labor Certification offers one avenue worth pursuing—data on the high-skill immigrant labor market. US companies legally recruit foreign workers to temporarily fill “specialty occupations” through the H-1B visa application process. Although H-1B visas are capped at 85,000 annually, applications have increased by 7.1x between 2009 and 2015, with the largest growth in Professional, Scientific, and Technical Services (10.7x).3
Wage pressure appears to be coming from lower-paying jobs
This data highlights two trends more consistent with the Census Bureau’s findings than the Fed’s observation: while demand for certain “specialized skill sets,” particularly in Professional, Scientific, and Technical services, remains high, wage growth for these workers since 2014 has trailed average US wage growth by one to two percentage points per year. In other words, the wage pressure in the US comes from the bottom end of the distribution, not the top. Holmes would likely refrain from calling this conclusive proof, but it would offer him more clay to build his story.
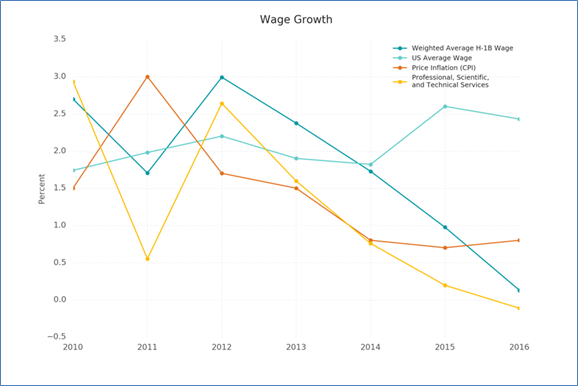
Implication: Look for inflation at the bottom, not the top, of the wage distribution
If wage pressure is rising in the US labor market, it appears to have bypassed most of the high skilled segment where H-1B applicants compete for jobs. Market participants searching for clues about inflation might find this guidance insightful. While Sherlock Holmes would probably not declare it definitive proof, he once noted that “there is nothing like first-hand evidence.”