
A paper co-authored by a current Two Sigma researcher recently won the Q Group’s 2016 Jack Treynor Prize, an annual award given for “superior academic working papers with potential applications in the fields of investment management and financial markets.”
The paper, Credit-Implied Volatility, by Gerardo Manzo (Two Sigma),1 Bryan Kelly, and Diogo Palhares, introduces the concept of a credit-implied volatility (CIV) surface. This framework organizes the behavior of corporate credit prices into a handful of easy-to-visualize facts. It also provides a clear visual diagnostic that seeks to explain where and why candidate credit risk models fail to match data.
Similar to its option-implied volatility analogue, the authors invert CIV from the observable CDS spread to provide a relative measure of CDS value, after accounting for the effects of maturity, moneyness, and the risk-free rate via the Merton (1974) model. Like the option-implied volatility (OIV) surface, the CIV surface aims to provide a compact graphical summary for how the relative price of default insurance varies by time to maturity and “moneyness,” where moneyness is defined as the distance between current asset value and the default boundary.
Three main stylized facts emerge from the paper’s analysis and are organized around an understanding of the empirical CIV surface. First, the authors identify a CIV moneyness “smirk.”
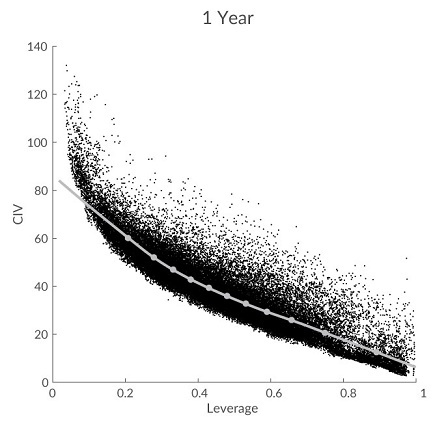
According to the authors, the chart above shows that CIV decreases steeply with higher levels of firm leverage, suggesting that firms with low leverage have unusually high CDS spreads in relative terms. Indeed, a disproportionately high amount of asset volatility appears necessary to generate a high enough probability of default and thereby justify the observed spread. Moreover, the CIV moneyness smirk is most steeply negative for one-year CDS, and gradually flattens out over longer maturities up to ten years.
The paper’s second stylized fact uses time variation in the surface to succinctly summarize the dynamics of CDS prices.
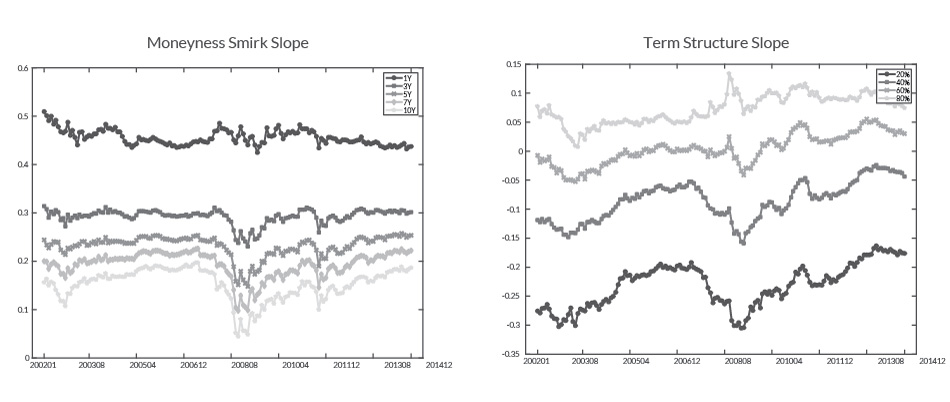
According to the paper, CIV across all firms and maturities demonstrate large common (and persistent) fluctuations over time. In recessions, the overall surface rises as default risk increases. The moneyness smirk flattens as the default risk of highly levered firms rises faster than firms with low leverage, and the term structure slope becomes more negative. The surface’s twisting behavior over time suggests that more than one factor is needed to describe the surface. According to the authors, a principal component analysis shows that three factors explain 98% of the surface and are highly correlated with the CIV surface level, term structure, and moneyness slope, respectively.
The paper’s third stylized fact moves from studying credit price levels to analyzing credit risk premia. CDS Sharpe ratios line up monotonically in the leverage and maturity dimensions. Holding maturity fixed, Sharpe ratios are highest for low leverage CDS and gradually decline as leverage rises. Differences in average CDS returns are nearly completely explained by heterogeneity in their exposures to the three common factors in the CIV surface.
Implications for practitioners
Given these three stylized facts, the paper proposes a structural model that prices the joint behavior of individual firms. In particular, firm leverage, maturity, and exposure to a two aggregate state variables (stochastic volatility and stochastic crash probability) capture the cross-sectional heterogeneity and time series dynamics in the panel of credit spreads. The paper’s estimated model seeks to formalize the intuition that large crash risk is necessary to match the high CIV values observed for firms with leverage below 20%.
According to the authors, the paper has important implications for practitioners. The paper seeks to identify a small number of common sources of variation in spreads, which provide a convenient summary of risk exposure in credit portfolios.
The paper’s CIV surface may be useful in choosing credit portfolio allocations and for hedging credit surface exposures. It also provides a simple means for stress testing credit portfolios against aggregate shocks by considering portfolio sensitivity to hypothetical shifts in the level, moneyness slope, and term structure slope of the CIV surface. According to the authors, most importantly, because the CIV surface is constructed only from observable spreads and the Merton model, the authors believe it is simple to construct and visualize, making it easy to monitor common risks in the cross section of credits.