
The canonical book-to-price based value strategy has been in a drawdown in the U.S. since the global financial crisis of 2008 (the “GFC”), leading many market commentators to question whether value investing is still alive.1 In this article, we highlight an interesting finding from a new Thematic Research white paper—that the profitability and operating efficiency of stocks traded by this strategy underwent a regime change around the GFC.2 The average profitability and operating efficiency of the US stocks identified as “overvalued” by the canonical book-to-price based value strategy has increased since the GFC, and vice versa for “undervalued” stocks. This recent disparity between book-to-price and these other metrics does explain to some degree the observed underperformance of the strategy since the crisis.
Introduction
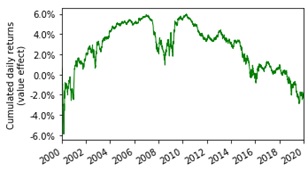
The value effect, traditionally defined as the spread between the returns of stocks with high and low book-to-price ratios, has experienced poor performance post-GFC as shown in Figure 1.3
The value strategy is typically profitable if book value adequately captures a firm’s true fundamental value. It has, however, been argued,4,5 that the traditional book value does not fully reflect fundamental value in the modern economy. Over the last decade, business models have changed such that intangible6 assets have become a significant driver of profitability.
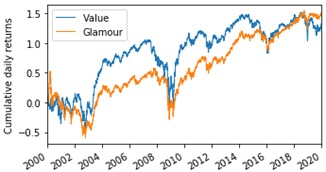
These intangibles are not included on the books-of-business under the standard accounting practice, and, hence, companies that are heavily invested in them may artificially appear to be overvalued under a book-to-price based measure of relative valuation. Supporting this, Figure 2 shows that the stocks identified as overvalued (which we’ll call “glamour” stocks) have done fairly well, which is contrary to what we expect from them, since they form the short leg of the traditional value strategy.7
If the traditional book value does not adequately account for all the assets that contribute to a firm’s profitability and operating efficiency, then any positive profits from a book-to-price based value strategy should be concentrated among the subset of firms where book-to-price valuations8 are most incongruent with measures of profitability and operating efficiency.9,10
Put simply, firms with very high book-to-price ratios (i.e., value stocks) that also have high profitability and operating efficiency are more likely to be successful contributors to a book-to-price value strategy; the same is true for firms with very low book-to-price ratios (i.e., glamour stocks) that also have low profitability and operating efficiency.
We provide some evidence in favor of this hypothesis in our accompanying white paper by outlining a methodology to estimate the daily levels of incongruence, studying the changes in these daily levels to look for any regime shift in the average level of incongruence, and, documenting the performance pickup in the book-to-price based value strategy when it’s limited to investing in stocks that exhibit high incongruence. In the next section, we discuss our findings from our regime change analysis that suggest a regime change in the incongruence of value and glamour stocks right around the GFC.
Regime Change
For a given time series defined over a given time period, we define a regime change indicator (detailed in the white paper) that quantifies, for each day T, the extent to which the average level of the time series before T differs from the level after T; a positive (negative) value of this indicator means that the average over the days before T is higher (lower) than the average over the days after T. The day on which this indicator is most positive or most negative will be the day that separates the time series into the two most different regimes. Figure 3 shows the plot of our regime change indicator for our measure of the daily incongruences of value and glamour stocks.
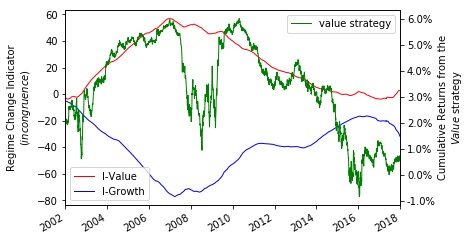
We see that somewhere around the middle of the year 2007 is when I-Value achieves a maximum, implying that the incongruence of value stocks before GFC was higher than that after GFC. In other words, the profitability and operating efficiency of value stocks—forming the long leg of the traditional value strategy—has declined over the recent decade relative to that over the period before.
I-Growth achieves its minimum around the same time, implying that the incongruence of glamour stocks before GFC was lower than that after GFC. In other words, the profitability and operating efficiency of glamour stocks—forming the short leg of the traditional value strategy—has increased over the recent decade relative to that over the period before.
Both of these trends bode ill for the traditional value strategy.
Furthermore, the fact that the plot is monotonically increasing (decreasing) for I-Value (I-Growth) before mid-2007 and then decreasing (increasing) afterwards indicates a gradual, as opposed to an abrupt, regime change in mid-2007.
All this points to the possibility that the poor performance of the book-to-price based value strategy since the GFC could have been driven by the forces that drove the regime change in incongruence of the value and glamour stocks.
A value strategy that accounts for the intangibles in a stock’s fundamental value is expected not to exhibit any regime change as exhibited by the book-to-price based value strategy. In the accompanying white paper, we show that a value strategy based on earnings yield—a value measure that accounts for the economic gains from intangibles—does not exhibit a regime change in its incongruence as exhibited by the one above.
Conclusion
The book-to-price ratio seems to have become less effective over the years at identifying value stocks, perhaps because the accounting book value does not take into account intangibles that have become a significant contributor to firms’ profitability and operating efficiency, and, hence, their fundamental value, in the new economy.
We show that in the U.S., the average profitability and operating efficiency of value firms most likely underwent a regime change around the GFC: The value firms, on average, appear to be less profitable and operationally efficient since the GFC than they were before. The opposite effect holds for glamour or overpriced firms. This regime change makes it reasonable to expect some degree of underperformance from a book-to-price based value strategy after the GFC.
The accompanying white paper shows that no such regime change is observed for a value strategy based on earnings yield—a value measure that accounts for the economic gains from intangibles. Additionally, it finds that the earnings yield based value strategy continued to be profitable after the GFC.
All in all, it follows that value investors incorporating intangibles in their fundamental valuation models would have profited in the last decade, as we show in the accompanying white paper. In this sense, the story of the recent decade-long drawdown of the book-to-price based value strategy may be that of book value becoming an incomplete fundamental valuation model for firms over that period.