The growing demand for advanced computing and storage capabilities has increased the emissions profile of the world’s data centers, with little sign of slowing down. Today, every square meter in a data center typically consumes as much electricity as about 10 American homes, and data centers account for roughly 1 to 1.4% of the electricity used worldwide, by some measures.1
Since data engineering and high-speed scientific computing are core to Two Sigma’s business activities, and since rising carbon emissions from data centers2 generally parallel rising expenses, reimagining information technology tooling under a carbon-aware paradigm would seem like a win-win: If we could make parts of our compute environment more efficient without sacrificing performance, we could both mitigate the company’s contribution to global carbon emissions while potentially reducing overhead costs.
The complex nature of modern, massive compute environments makes this proposition far more easily said than done. Over the past year, however, Two Sigma’s Sustainability Science team has been investigating ways to make progress on this front. The team brings together Two Sigma’s people, data science, and engineering capabilities to propel ESG considerations that we believe will lead to continued firm success and long term sustainability across Two Sigma’s businesses and the broader community.
This article highlights some of the early initiatives the Sustainability Science team has led to accurately determine the carbon footprint of certain parts of Two Sigma’s compute environment, with a specific focus on a critical first step: How to measure power consumption at the server level accurately, in order to lay the groundwork for increasing our systems’ efficiency. It then outlines proposed next steps to advance our sustainability initiatives, with an emphasis on capacity-building and education.
Early initiatives: A scientific approach
When it comes to addressing carbon emissions (or any other challenge), the team must ensure its efforts account for our internal partners’ priorities and capabilities. One of the first strategic steps we’ve taken on this project has been simply to begin adding a sustainability lens to existing initiatives, where practicable.
Specifically, using this approach, we have begun:
- Repurposing open source APIs to measure power consumption at a server level and use the resultant data to calculate an estimated compute carbon footprint (more on this below).
- Exploring the adoption of open source methods for in-house carbon intensity forecasting.
- Investigating methods for using our data centers more efficiently when we are tenants and not owners of the facility.
- Developing a pilot method for measuring the emissions from a set of virtualized tasks.
- Assigning cloud carbon emissions to teams and users based on the carbon emission data provided to us by a cloud provider in alignment with Two Sigma’s cost-sharing framework.
- Studying software optimizations and pipeline refactors for sustainability gains.
- Identifying in-flight initiatives that target the use of efficient programming languages.
- Partnering with teams to calculate changes in carbon emissions from applications refactors.
- Investigating methodologies to schedule non-critical workloads to times of day when the electricity grid is least carbon intensive.
In focus: Repurposing open source APIs to measure power consumption at a server level
While each of the above initiatives is important, this article will focus on the work we’ve done to tackle the hard problem of measuring power consumption at the server level. Not only is this a fundamental area of inquiry and one where we’ve made significant progress, but it’s also illustrative of a truth many organizations run into when they attempt to become more efficient and carbon-aware: Often, what seem to be elementary tasks in driving carbon efficiency—such as measuring exactly how much electricity they use—turn out to be surprisingly thorny issues that require imaginative solutions.
The challenges of measuring energy usage
The science component of this work is central to Two Sigma’s vision in this space. We want to know the exact impact of any future interventions and whether that impact can be replicated and codified. The team’s ability to express carbon intensity is, however, directly dependent on data coverage and quality, as well as access to underlying company source systems. This means we need to calculate carbon intensity using data at a unit of analysis that’s actionable for Two Sigma.
Metered electricity bills and cloud provider data offer power consumption—or emissions estimates—by month. This means that (at most) we would have 12 data points to work with for each data center or cloud vendor billing unit; far too few to conduct rigorous inquiry. So, rather than relying only on metered electricity bills and cloud provider data, we want to measure and be able to report internally on carbon emissions at a department, server, and even tool level. After all, as the adage goes, if you can’t measure it, you can’t manage it.
Gathering energy consumption data at a server level is not necessarily straightforward, however. Two Sigma does not always own the data centers it uses, but is sometimes a tenant of colocation centers. Moreover, most of our servers are housed in cabinets and wall-metered at a rack level. Even if we could perform reliable power consumption attributions from power distribution unit to rack to server, our data centers tend not to offer disaggregated reports readily. An alternative might be to wall-meter each server ourselves through specialist physical hardware, but this would be costly to purchase, install, and maintain.
Tailoring a solution to Two Sigma’s needs
After evaluating numerous options, we aligned on a workstream to repurpose the existing tools infrastructure engineers use every day to monitor server health. The Intelligent Platform Management Interface (IPMI) could provide a workable alternate route. IPMI allows sensor data, gathered by current-generation servers’ baseboard management controllers (BMCs), to be accessed over a common API.
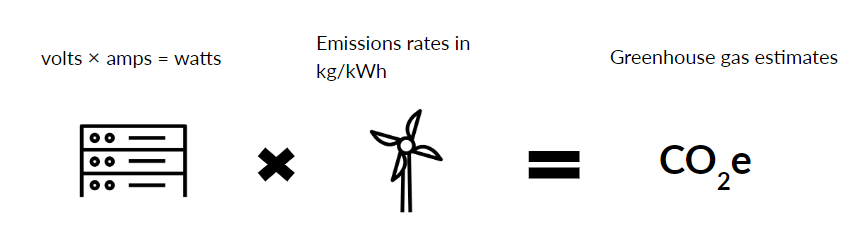
For this project, we leveraged the BMCs’ power-sensing capabilities. Sensor readings for voltage and current (amperes), which detect changes in the magnetic field, can be multiplied to get wattage. The sensors poll at a fixed interval (approximately once every 10 seconds) and the resulting wattage values can be averaged over a sample period to estimate the average power draw over a period of time. We use these data at various granularities, from hourly to weekly, depending on the use case.
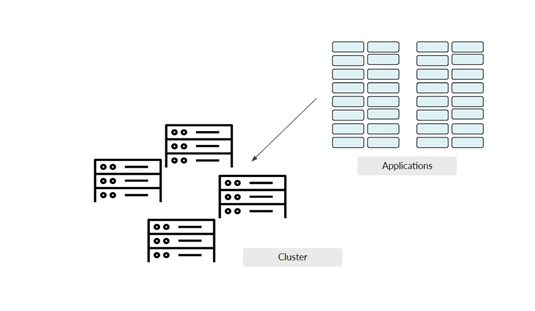
This technique works well for servers that are single-tenant, but self-service, container-based solutions are trickier. For Two Sigma-managed Kubernetes-based solutions, we can directly measure the power consumption for each cluster in the same way that we measure the power consumption for a collection of servers. Under this paradigm each server is a node in the cluster. The nodes run containerized applications. The number of applications running at once depends on the amount of memory and vCPU requested and allocated, but it can be as few as 1 or as many as 100.
Just as a server can support a finite workload based on how much memory and cores that workload requires, nodes in a cluster are actively monitored to make sure that the amount of resources requested – in total – at any point in time doesn’t exceed what the service can support. Assuming we can map all applications running on a server (i.e. node) at once, we can try to understand what portion of that server’s electricity usage should be attributed back to any application as it was running at a particular point in time.
To access the variables we needed to apportion electricity usage across applications, we repurposed another existing tool. Kubelet, the native Kubernetes API, can be accessed via the Prometheus API, and has CPU and memory utilization data among other useful data points.
While this work is ongoing, it has allowed us to collect and share initial data on the carbon footprint of Two Sigma’s bare metal servers, container-based solutions, and cloud services—a critical step toward ultimately finding ways to increase efficiency and potentially reduce both emissions and compute expenses..
Looking ahead
Our scientific computing and engineering infrastructure facilitates a complex ecosystem of expert choice-making. And as we’ve seen, there’s no one obvious lever to pull that will make our operations instantly more energy-efficient. Innovation and uncertainty often go hand-in-hand, and to increase employees’ ability to grapple with issues related to carbon emissions and technology efficiency, we take time to offer educational programming and conduct awareness-raising activities.
In many cases, greater education is a prerequisite for greater collaboration and, ultimately, better strategic interventions. That’s why the team hosted a special internal Earth Day 2023 event earlier this year, featuring a forward from Two Sigma leaders and a special guest appearance from a major commercial real estate firm’s global VP of sustainability, to introduce the root causes of the climate crisis, explain how electricity consumption generates emissions, and explore ways to reduce software and hardware carbon intensity.
Armed with both an understanding of the sustainability challenges data centers present and adequate server-level carbon footprint data, for example, colleagues and peers can make more efficiency-aware choices when architecting solutions.
Looking ahead, the Sustainability Science team will continue to produce and interpret data while communicating our learnings and successes internally and, increasingly, to the outside world (watch this space!). Our vision of success going forward is that through continued educational programming, awareness-raising, and collaborative inquiry, we will be able to expand the range of possible choices our colleagues and peers can make when designing and deploying software and hardware solutions.
The steps outlined in this article clearly represent not an end-state, but a beginning. We are excited to share further learnings as we develop them. We also look forward to sharing case studies and methodology to encourage others to engage and develop best practices in the sustainability space. In the meantime, if you’d like to know more or have ideas for collaboration, drop the Sustainability Science team a line at sustainabilityscience@twosigma.com.
P.S.
Rachael Weiss Riley and Jennifer Badolato of Two Sigma’s Sustainability Science team will be attending The Hub Live as part of Climate Week NYC on September 18 and 19, 2023. If you see us, introduce yourself!