The link between inflation and the labor market has cracked, and greater uncertainty about the direction and effects of monetary policy may result.
After A. W. Phillips discovered the eponymous “Phillips Curve” in 1958 when comparing UK inflation rates to unemployment levels (Phillips, 1958), the relationship between inflation and the labor market became a central tenet of macroeconomic orthodoxy and monetary policy.1 The US Federal Reserve’s dual-mandate reflects that tenet. In order for the Federal Reserve to simultaneously target price stability and maximum employment, monetary policy needs to influence both. As a result, market participants tracking changes in future economic states, as well as future monetary policy, have looked to the labor market as a signpost carved in stone.
Tracking the inflation-labor market relationship
However, the relationship between inflation and the labor market no longer stands up to certain statistical tests. Depending on the economist, and perhaps on the day, the fissure emerged during the Great Recession that started in 2008, it emerged during the Great Inflation that afflicted the 1970s, or perhaps it never really existed.2 Whether that crack fatally condemns the intellectual underpinning of the Phillips Curve remains a topic hotly debated in the academic literature. Google Scholar, for example, recognizes nearly 1,800 articles on the topic since the beginning of 2015.3
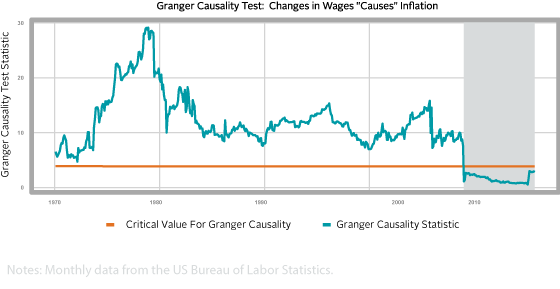
(and vice versa). This figure depicts the results of that test. Download full article for additional details.
In lieu of offering another perspective through the widely viewed Phillips Curve lens to look at unemployment and inflation, this Two Sigma Street View takes a slightly different approach. The empirical analysis in this issue estimates a vector autoregression model (VAR) to identify the relationship between wage growth and inflation. Between 1970 and 2008, there existed a statistically significant, causal relationship between US wages and consumer prices. Since 2008, that relationship seems to have dissolved. As a result, market participants should expect more uncertainty in terms of both monetary policy decisions and the effects of those decisions. The once perceived “rock solid” signpost seems to have lost much of its signaling value.