Last February’s sudden spike in the VIX, the implied volatility index of the S&P500, reminded investors of the unforeseeable and potentially severe nature of market shocks. Although markets seem to have adjusted quickly following that episode, addressing uncertainty still remains one of the top priorities for investors.
It is widely accepted that the VIX is a reasonable proxy for equity market uncertainty.¹ However, the VIX is an incomplete yardstick, measuring only expectations of volatility implied by the S&P 500 (which itself only encompasses a narrow slice of the U.S. equity market). Uncertainty (defined as the conditional volatility of an unforecastable shock) can take on additional forms, however, and its effects can manifest in many other areas of the financial markets. It can relate to macroeconomic activity or financial markets, as well as to unconventional risks, such as geo-political risk or monetary policy risk.
Quantifying macro and financial uncertainty
This Street View shows that there appear to be two main, separate types of uncertainty that investors should be aware of when making investment decisions: macro and financial uncertainty. In this setting, uncertainty arises from the unpredictability of multiple economic or financial indicators as a whole, rather than their single dispersion per se.
Using a cross-section of 132 macroeconomic indicators and 147 financial time series related to the U.S. economy,² this Street View constructs measures of macro and financial uncertainty following the methodology in Jurado, Ludvigson, and Ng (2015).³ The macro indicators come mainly from the FRED-MD data set and include data from categories including output and income (e.g., production), labor market (e.g. employment), housing, consumption, orders, and inventories, money and credit (e.g., M1, M2), interest and exchange rates (e.g., T-bill), and finally, prices (e.g., finished goods). The financial uncertainty variables are mainly industry and style factors from Kenneth R. French’s data library.
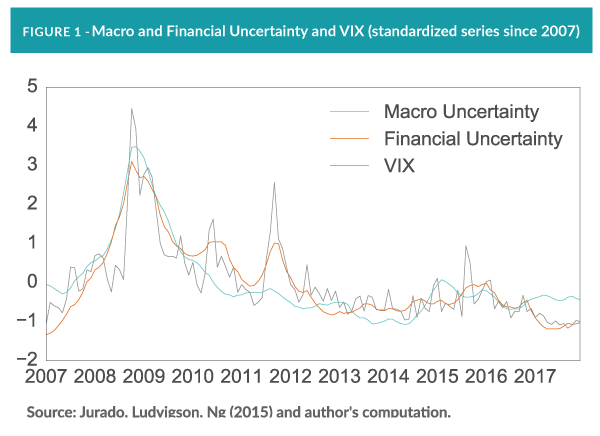
Each uncertainty indicator is constructed by equally weighting one-month-ahead forecast errors for each indicator in the two cross-sections. Figure 1 plots the (standardized) macro uncertainty, financial uncertainty, and the VIX since 2007, the period leading to the financial crisis of 2007/09, and shows how they compare with the VIX during the same timeframe.

Since the large spikes at the end of 2008, both macro and financial uncertainty measures have slowly reverted to pre-crisis levels, with the former falling below 2007 levels. While macro uncertainty has remained stable (and higher than financial uncertainty) in recent months, financial uncertainty seems to be trending up, after having declined in the wake of the 2016 U.S. elections.
How can uncertainty affect investors?
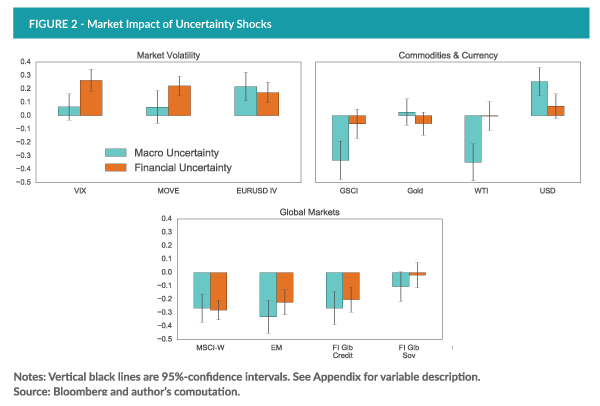
Macro and financial uncertainty appear to affect financial markets in different ways. To understand the potential consequences for investors of uncertainty shocks on future asset prices, Figure 2 plots the loadings of a regression of a set of market variables on one-month-lagged values of the two measures of uncertainty.⁴ For ease of comparison, each series is scaled by the standard deviation. Each loading, therefore, represents the correlation coefficients. These market impacts are divided into three categories: market volatility, commodities, and global markets.

The top-left chart shows that financial uncertainty seems to be significantly related to stock and bond markets’ implied volatilities (VIX and MOVE, respectively). But financial uncertainty has only shown a roughly 40% correlation with the VIX over this measuring period. Clearly, the VIX doesn’t tell the entire story, given the large cross-section of financial indicators used to construct financial uncertainty
Currency volatility, Figure 2 shows, is positively associated with past (one-month) realizations of both types of uncertainty, reflecting its comparatively strong dependence on macroeconomic fundamentals. Indeed, as shown in the top-right graph, a rise in macroeconomic uncertainty appears to lead to an increase in the return of the USD against a basket of foreign currency, probably driven by a flight-to-quality effect. Moreover, the negative correlation between macro uncertainty and commodities in general, as represented by the S&P GSCI index and WTI oil prices, suggests that returns on commodities are influenced by cyclical economic forces, rather than financial risk.⁵
Finally, the bottom chart reports the impact of both types of uncertainty on global stock and fixed-income markets. Both are nearly equally important for global equity and fixed-income markets, as highlighted by the negative loadings. In the case of global government bonds, the effect of macro uncertainty is pronounced.
Implications for investors
The widespread belief that the VIX alone captures aggregate market uncertainty is inaccurate. It may be a reasonable proxy for financial uncertainty, but it does not adequately capture macroeconomic uncertainty. Macroeconomic uncertainty, instead, appears to be a separate entity with its own impacts on asset prices. For that reason, it deserves attention. Recent research shows that large, positive macro uncertainty shocks can lead to a sizable and protracted decline in real activity (production, hours, and employment—Jurado, Ludvigson, and Ng (2015)). This Street View further illustrates that these shocks also seem to have significant, short-term implications for certain asset prices. Indeed, the latter’s apparent link with commodity prices, the USD currency basket, and global government bonds may provide relevant insights for investors who base their asset allocation on macroeconomic scenarios.
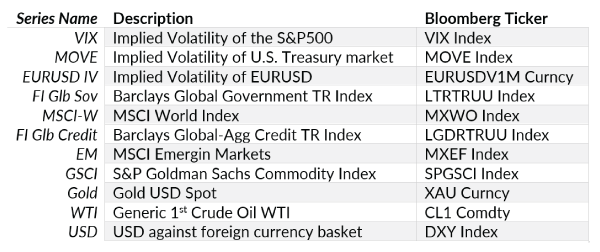
Appendix: variable description


