
Last month’s Two Sigma Street View highlighted two aspects of the recent performance and risk characteristics of the SG CTA index.¹ First, the SG CTA index in August had a more significant long exposure to both equities and bonds than its 2000- 2017 average, making it less diversifying to a 60/40 portfolio than usual. Second, only four factors— equities, bonds, energy, and the US dollar—appear to explain an unusually high share (60 percent) of portfolio risk.
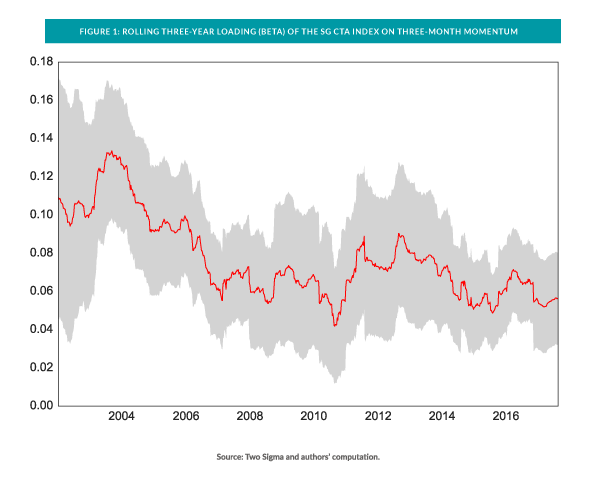
The August 2017 Street View spurred several interesting dialogues with clients. One common question centered on the role that momentum has played in explaining CTA performance. Specifically, has the generic CTA manager (proxied by the SG CTA index) become less focused on price momentum and more focused on “fundamentals”? Figure 1, below, supports that hypothesis—with two important caveats.
- Risk factors are not generic, so there exists no single definition or construction of momentum. For example, the horizon matters. Short-term momentum (e.g., one month) and long-term momentum (e.g., one year) frequently point in conflicting directions. The algebraic formula for calculating momentum also matters. A simple moving average will equally weight all data points within the window, and it may lead to large day-today fluctuations when an outlier at the tail end of the window drops out of the sample. In contrast, an exponentially weighted moving average will appear less sensitive to past outliers but more sensitive to recent ones. The analysis in Figure 1 employs a three-month, simple rolling-mean macro momentum factor, in line with an industry standard.
- CTAs often trade multiple asset classes with conflicting momentum. An obvious example is equity and bond futures. During prolonged periods of market stress, bond momentum tends to be positive while equity momentum tends to be negative. The momentum factor in the analysis below is aggregated across the futures contracts in the Two Sigma trading universe. With those caveats in mind, the figure shows that the beta in a regression of SG CTA index returns on a macro momentum factor fell by a statistically significant amount between 2004 and 2007, suggesting that CTAs during this period may have slightly reduced their reliance on macro momentum to drive returns. The regression uses a window of three years of weekly returns and controls for some confounding factors, like carry in commodity, foreign exchange, and fixed income futures, as well as equity exposure.² Since 2007, the beta has fluctuated by economically significant amounts (e.g., doubling between 2011 and 2013).
Potential implications
The implications of this trend (no pun intended!) may depend on the allocator. Some may find support for the seemingly healthy development that many CTA managers have become more akin to global macro managers, in that they seem to rely less on simple technical signals. Other allocators may merely be looking for an explanation for CTA performance.
Perhaps the most important takeaway, from both this chart and last month’s analysis, is the importance of measuring both manager-specific and overall portfolio exposures in risk terms. Relying on the historical reputation of a strategy type to provide portfolio-level diversification appears at best coarse and at worst misleading. In contrast, applying simple statistical tools to decompose risk into factors might provide more accurate insights, potentially enabling an asset allocator to manage her portfolio with more precision and, hopefully, greater utility.