Elections, as the saying goes, have consequences. For financial markets, these effects tend to concern the potential for far-reaching policy changes to filter through to asset prices, typically in one of two ways:
- As market prices change to reflect expected outcomes.
- As options prices react to significant sources of uncertainty, and reflect volatility around when that uncertainty may be resolved.
In the past we have written about how financial markets price in the probability of expected shocks and how policy changes are priced into the market. But what about measuring the risk of the election?
This Street View proposes a method for teasing election-related risk out of options prices and tests it against FiveThirtyEight’s 2018 election forecasts based on polls and fundamental data.1 We find a statistically significant time-series correlation between our options-based measure of election-related risk and the expected election variance, or unpredictability, in FiveThirtyEight’s House and Senate classic model forecasts. While there is certainly more research to be done, the results suggest that our option pricing methodology provides another lens to explore event-related risk.
Introduction to methodology
1. Estimating Election Risk from Options Prices
Options prices on an underlying security account for both the current price of the security and the market’s expectation of its risk (i.e., implied volatility) until the option’s expiration. If we are concerned about the risk of a particular event, such as the upcoming midterm elections, it is possible to see if the market is pricing in “extra” risk around that event for any security by looking at the prices of options expiring immediately before and after the event, and comparing the increased volatility expected for the time period including the election to the average volatility expected for all other time periods. Further details on the calculations may be found in the Appendix (see PDF).
Our method implicitly assumes that the election is a one-time “shock” to security prices, and can estimate the variance of that future shock. A high level of excess variance priced into options expiring around the time of the election for a particular security would imply both that the outcome of the election is expected to have a particularly strong effect on the value of the security, and that the election is perceived to be a large source of risk (i.e., relatively close). Both conditions must hold to see a large expected risk priced into options; if the election were considered a foregone conclusion, then the expected outcome would already be priced into the securities themselves and there would be little election-related risk priced into the options.
Since most foreign-policy power is held by the executive branch, one would expect the 2018 election (centering around the legislative branch) to have a relatively greater impact on domestic policy and US-domiciled companies rather than foreign exchange rates or other cross-country effects. We therefore limit our analysis to options prices for nineteen US sector ETFs with listed options and substantial liquidity.2
2. Estimating Election Risk from FiveThirtyEight Forecasts
FiveThirtyEight produces district-level and aggregate election forecasts for both the House of Representatives and the Senate.3 Assuming that control of each chamber can be treated as a weighted coin flip, we can estimate the implied risk of the upcoming election from forecast win probabilities as the variance of a Bernoulli distribution: p(1-p), where p represents the chance of Democrats (or Republicans) taking control of each chamber. The maximum “uncertainty,” or variance, for an election is when the outcome is most uncertain—when the probability that either party will control a chamber is 50%.
Given this definition of election risk, we use the historical values from FiveThirtyEight’s “classic” model forecasts to measure the expected variance each day for the expected party control of both the House and Senate. We are thus able to calculate:
- “House Variance” = expected variance of the House control outcome,
- “Senate Variance” = expected variance of the Senate control outcome,
- “Combined Variance” = mean of House and Senate variances.4
Testing the Model: How Midterm Election Risk Evolved over 2018
In examining the excess variance over the election period (henceforth “Election Variance”) priced into US industry and sector ETFs, we found relatively little evidence that individual industries or sectors were particularly sensitive to changes in election outcome risk. However, we did find that the average Election Variance priced into the options on all 19 ETFs appeared to covary significantly over time with the forecast election risk from FiveThirtyEight’s model.
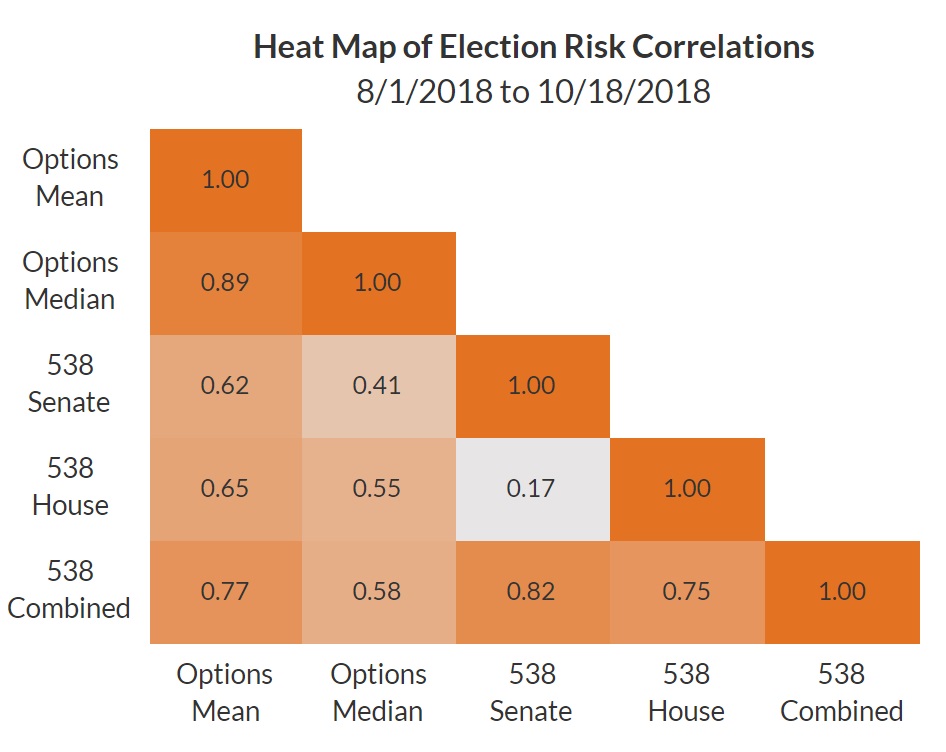
Over the period where FiveThirtyEight’s election predictions were available, from August 1, 2018 to October 18, we also found that our average option-derived estimate of Election Variance was significantly correlated with the “combined variance” ( 0. 77) of the FiveThirtyEight forecast probabilities for both chambers. The options-derived measure also exhibited significant, but lower, correlations with the variances implied by the standalone Senate (0.62) and House (0.65) forecasts. The period examined ends on October 18, 2018, as October 19th was the expiry date for October-dated ETF options, and more idiosyncratic drivers of near-term options pricing, such as hedging demand, made our Election Variance estimate based on November options much noisier on a day-to-day basis.
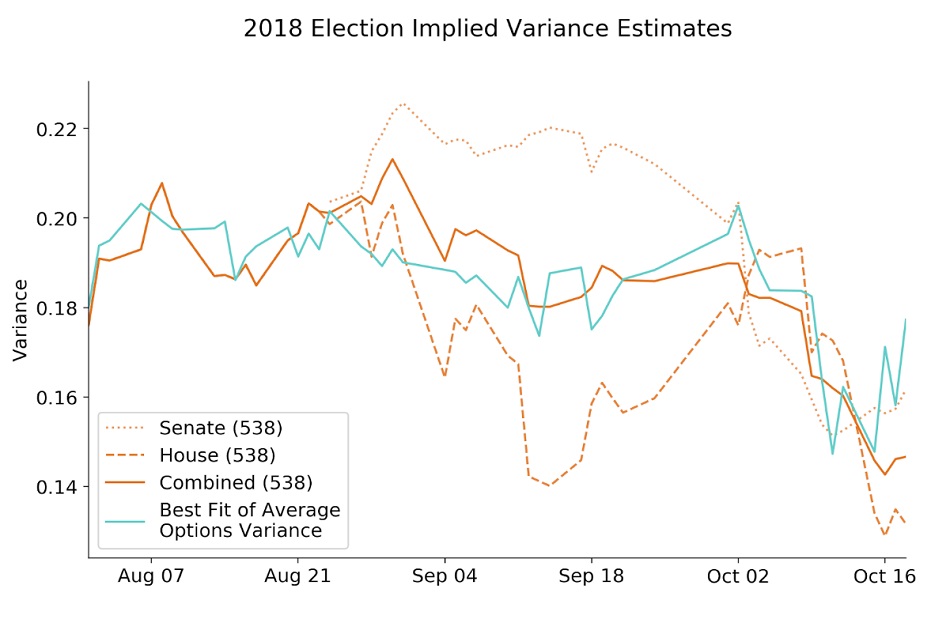
The chart below shows the “best fit” linear transformation of the daily average options-implied Election Variance versus the implied variances of the House and Senate forecasts from FiveThirtyEight as well as our combined variance average. We believe the fit in late October may have been affected by short-term dynamics of the options markets as investors moved from the soon-to-expire October options into November options to hold any hedging or speculative positions.
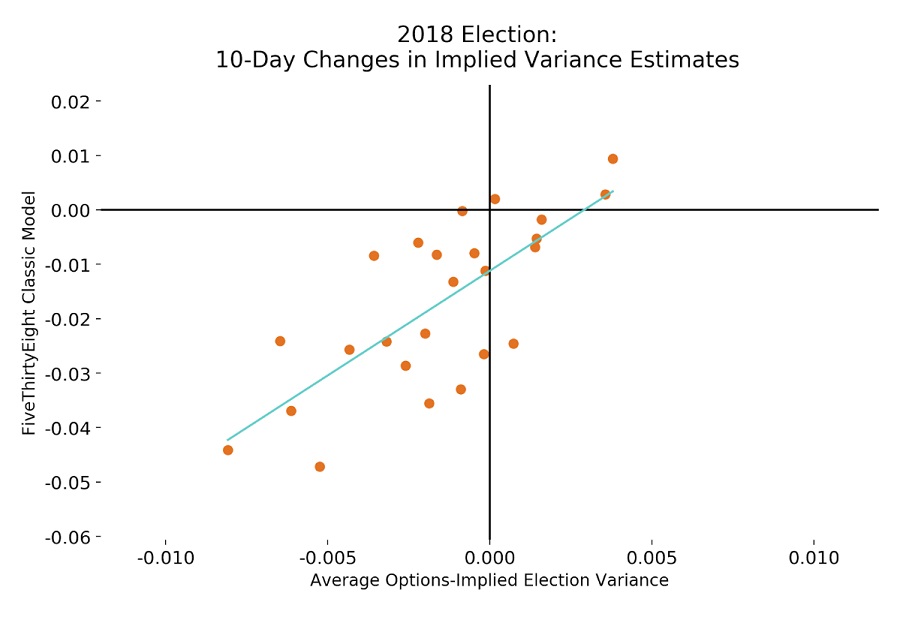
Although the Election Variance estimates show a statistically significant relationship over time, we also want to make sure that, in addition to their levels, the changes in both series over time are meaningfully related. This can provide more confidence that both the FiveThirtyEight implied variance and the options implied variance are reacting in similar fashion to fundamental news. As the FiveThirtyEight forecasts are smoothed over time to avoid overreaction to new polls and data, we chose to look at ten-day changes in each series to allow for some lead-lag effects when forward-looking views on election risk are incorporated to both series.5
Conclusion
Although it seems reasonable to expect that options prices incorporate the risk of known events such as elections, we believe that the strength of the results above are somewhat surprising. This methodology for extracting the uncertainty of future events deserves further analysis, especially to see if we can disentangle the impact of an election’s uncertainty (i.e., how close to a toss-up it is) from the “importance” of an election. Measures of party polarization6 or sentiment of election-related news might be relevant to the size of elections’ impact on security prices and risk.
While this initial analysis appears promising, we look forward to further expanding our analysis of different elections and political events to see if the effects found in this Street View are robust.