Every ten years, the US federal government conducts what is arguably the most important and foundational of data collection tasks, the Decennial Census. This constitutionally mandated count of every person in the United States (and five US territories) will form the basis for a wide range of decisions that have to be made over the next decade.
The Decennial Census will determine how congressional and state district boundaries are drawn and how more than $800 billion in federal funds will be allocated to communities and vital programs across the country. The results of the 2020 Decennial Census will profoundly affect everything from politics to education, housing and transport over the next 10 years.
Given the central role that the Decennial Census plays in American life, it is crucial that the count be as accurate as possible. One study in 2015 concluded that communities undercounted in the 2010 census lost between $533 — $2,309 per person from federal programs (e.g., Medicaid) that allocate reimbursements and payments based on census-derived statistics.
The 2020 census faces additional challenges that make the probability of an undercount higher than normal. The counting period, which started in mid-March and extends through December, is happening during a pandemic, one of the worst global health crises the world has seen. To curb new Covid-19 infections, many state and local municipalities have implemented shelter-in-place and social distancing measures, which means that census workers are limited in the types of outreach they can perform, with in-person events mostly impossible.
In addition to the difficulties of outreach operations during a pandemic, this is the first year that the census is being conducted largely online (if you haven’t responded yet, you can do so here). For the 2010 census, participants received physical forms in the mail which they were asked to fill out and return to the Census Bureau. Households that failed to self-respond through the mail form were then visited and counted by an enumeration officer visiting the household.
In 2020, most of the population will receive a small letter in the mail explaining how to self-respond online, and a small percent of these households will also receive the traditional physical mailback form. The addition of an online option has the potential to make the census more efficient and accurate by increasing self-response and limiting more costly in-person enumeration. However, it remains unclear whether differential access to, and comfort with, this new technology might negatively impact some communities.
The broader question of how the 2020 census is shaping up with respect to self-response is being tackled in many different ways. For a national perspective, the CUNY Mapping Service out of the Center for Urban Research, CUNY Graduate Center has created the Hard to Count Map to support an accurate count in 2020. In partnership with Hester Street, a nonprofit involved with census outreach efforts in New York City (NYC), we produced this online dashboard tailored to local data. As a product of this collaboration, we began thinking about how Covid-19 might be influencing self-response at the local NYC level and how patterns in response rates compare to what we’d expect in non-pandemic times.
While it is impossible to assess the effects of different factors (pandemic, online option, etc.) on the final census count while it remains ongoing, we can derive some insight by analyzing the daily self-response rate released through the census API. The API provides both the online/internet self-response rate and the total (internet plus mail-in) rate at the census tract level. Given the previous day’s data is overwritten daily at 3pm EST, we wrote a script to automatically download and store the daily rates for later analysis. You can access this data on our GitHub repo, and it is also being collected and stored independently in this data.world collection.
Plotting both the daily and cumulative response rates gives us a quick view into how the census is progressing in NYC (Figure 1). Below, we show the daily mean total response rate in blue as well as lines for the 2020 cumulative total (orange) and internet rates (red) starting on March 22, the date that NY’s stay-at-home order went into effect. As a reference point, the static blue line represents the final 2010 response rate.
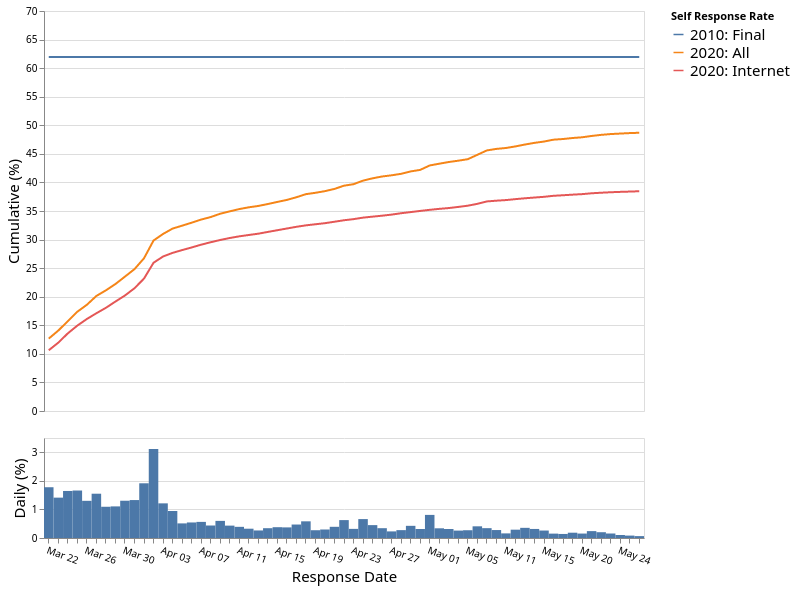
After a strong start in March and a peak on Census day (April 1st), the daily response rate has dropped by roughly 50% in April and May across the city. We can also see that the vast majority of people are responding through the internet form (orange line), but that mail returns make up an increasingly larger proportion of the self-response rate over time. We also looked at the response rates across individual boroughs and found similar patterns (check out the figures here). The one exception was the Bronx, which demonstrates a higher reliance on mail-in forms; perhaps not that surprising, given that it has the highest proportion of households receiving both the internet and the mail form.
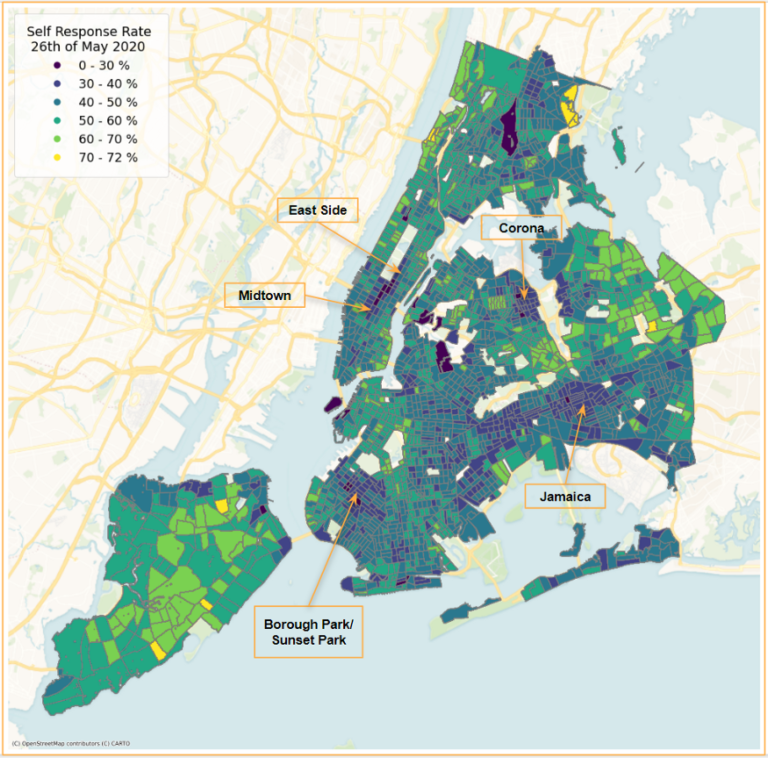
We can also explore the progression of the census at a higher geographic resolution by mapping the cumulative 2020 self-response rate data at the tract level. Figure 2 shows the state of the census as of May 26th, 2020. There is clear variation both within and among the boroughs, with areas in darker blue demonstrating a lower response rate than those in light green. Specifically, regions in Manhattan (Midtown and the East Side), Brooklyn (Borough Park/Sunset Park), and Queens (Jamaica, Corona) have response rates of less than 40%.
As interesting as the raw rates are to visualize, it’s perhaps more instructive to look at the current response in reference to the 2010 census. Ideally we would compare the daily 2020 rate to that of the same day in 2010. Unfortunately, the Census Bureau does not publish daily 2010 rate data, so we are left comparing the current rate with the final 2010 self response (Figure 3). This enables a comparison: how far off is each census tract from its expected final response rate, assuming responses in 2010 and 2020 are similar across time and geography? Are some neighborhoods lagging their 2010 performance, perhaps indicating an area at risk for an undercount?
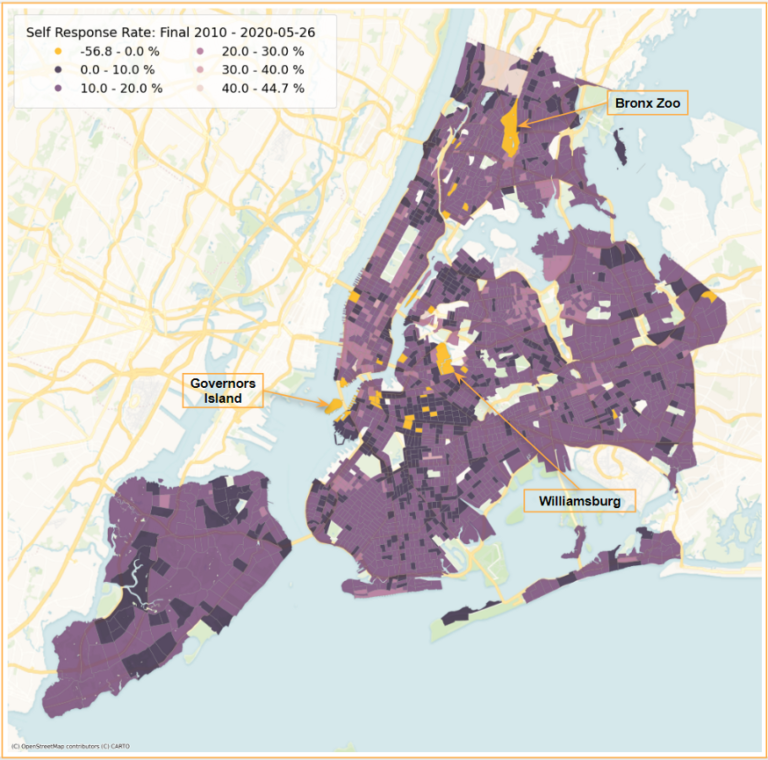
To answer this question, Figure 3 maps the difference between the final response rate in 2010 and the rate on May 26, 2020. The yellow tracts in this map show regions that have already surpassed the final 2010 rate. These are mostly low population areas (like Governors Island, industrial Williamsburg, and the Bronx Zoo) and are likely due to issues mapping the 2010 response rate to 2020 census tracts. The darker purple regions on the map are closest to meeting their 2010 rate, while lighter purple areas are indicative of tracts that are up to 45% short of their final 2010 self-response. To help identify areas at either extreme, Figure 4 depicts the 10% of tracts furthest away from their 2010 rates in pink (highest 10%) and the 10% closest to meeting 2010 responses (excluding those that have already exceeded their 2010 rate) in green (lowest 10%).
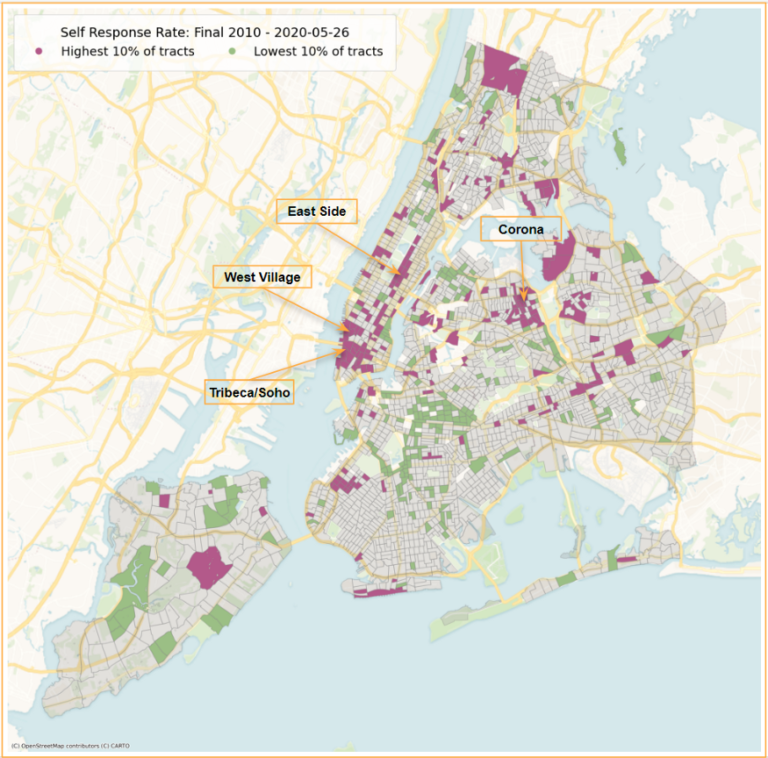
Interestingly, large parts of Brooklyn as shown in green are pretty close to meeting their 2010 expectations, especially in neighborhoods like Bedford-Stuyvesant, where outreach efforts have focused on making sure addresses are accurate and people self-respond. In contrast, large regions of Manhattan, including the West Village, Soho, Tribeca, and the Upper East Side appear to be trailing 2010 response rates. There are additional low response clusters in a few Bronx neighborhoods and in Corona, Queens.
Before jumping to conclusions, it’s important to understand the caveats when comparing the final 2010 rate to the current 2020 response. For example, we don’t know how things will evolve between now and the end of the self-response portion of the census. Perhaps regions with a high gap will catch up as the census progresses, while regions that are close to their 2010 rate will tail off.
However, despite these limitations, there are some surprising spatial patterns. Namely, that the regions of Manhattan that appear to be lagging their 2010 response are some of the most expensive neighborhoods on the island. There have been several reports that many people who had the financial means to leave NYC did so at the start of the Covid-19 pandemic. It’s possible that those individuals, no longer at their primary residence, have not received the mailed instructions on how to fill out the online census, or perhaps they completed the forms for the address where they currently reside. Either way, this could certainly account for some of the discrepancies we see in these higher income parts of Manhattan.
Over the next few months, as the census proceeds, we will continue to explore the response rate data both in a local context and more broadly across national trends. We will keep track of how it evolves and identify how neighborhood characteristics may be related to the patterns we see. If you can’t wait for our updates, or if you just want to dive into the data yourself, you can check out our GitHub repo.