
The second post of this series on our collaboration with Vera Institute of Justice, discussed how we standardized call types, Call for Action (CFA) codes, and disposition types into a common condensed taxonomy. This facilitates easy comparison of top-level 911 call characteristics between cities and allows us to answer questions about how different cities handle responses to 911 calls. However, it does not allow us to easily study each city individually or ask questions about variations in 911 call types, their originators, and their outcomes between neighborhoods or over time. To do that, we need to be able to ask questions about our variables based on some standard sub-city geography and on a common unit of time.
How Do Cities Report the Location of a Given Call?
Each of the cities we examined (with the exception of Seattle) provided an (x,y) location for each call. Less clear is exactly what this location represents as it could be one of several different options:
- The georeferenced address that a caller gives when making a call.
This is the most likely, given that officers responding to the call need to know where to physically go. If this is the case, it’s not clear what the accuracy of the location may be. For example, is it a precise building address? What about when the call is happening out in the world where there is no associated building? Does the georeferenced point then refer to an intersection? - The location of the device that made the call.
The Enhanced 911 system provides a location for each 911 call reflecting the known physical address for landlines or geographic coordinates based on cell tower when a call comes from the cellular network. Is this what is being reported? - The location of the conflict determined by law enforcement.
This could also be the location where an officer determined the incident was actually place when they arrived on site.
It’s hard to know for sure what the location data associated with each call actually represents. Moreover, we failed to find any reliable documentation that explains this on the open data portals for each city. We would recommend that a location type column be added to 911 open data in the future to clarify what the locations refer to. Additionally, it would be helpful to know whether the geographic identifier pertains to the location of the caller or to the incident being investigated.
Some cities also provided contextual location information in the form of the police district or beat associated with the call. It’s again unclear, however, if this refers to the physical area where the incident occurred or the district/beat that the responding officer was assigned to. It’s easy to imagine scenarios where this might be inconsistent.
How Do Cities Reference a Given Location?
A further issue related to location data stems from the coordinate system being used. Some of the cities on our list reported the location in latitude and longitude coordinates, but others have legal mandates to report the location of a call as state plane coordinates (SPC). The latter coordinates consist of a system of 124 geographic zones across the US, in which states usually have multiple SPC systems that typically follow county lines. Each coordinate system specifies location on a different Cartesian grid, and the corresponding units of measurement can vary: meters, km, etc.
This means that if we want to consistently map the call locations in each region to different geographic boundaries, we first have to convert them to a common coordinate system. We have selected latitude and longitude, but as long as the system is standard and consistent, the precise choice will not affect the kinds of analyses we wish to perform.
One of the difficulties we found in doing this work was a lack of documentation on each city’s open data portal describing the coordinate system and units used. We recommend that each city that publishes 911 call location data should make it clear which state plane coordinate system is being used and what units the coordinates are in.
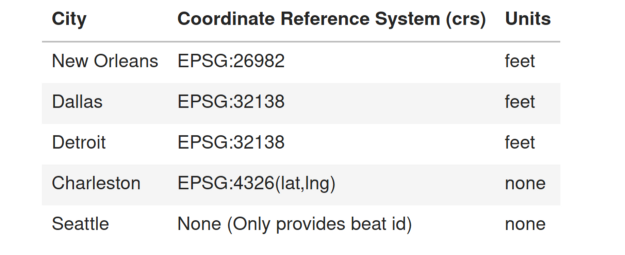
Table 1 shows a summary of the location columns for each city in our study and the geographic systems they use to report them.
Aggregating to Census Tract and Beat Geometries
Having the coordinates themselves in a standard format helps with analysis and allows us to combine the multiple files we have from each city into a single data table with a common Cartesian (x,y) coordinate system.
While having such specific location information is helpful, when analyzing calls, we often want to think about the data in aggregate over some specific geographic region. The two most commonly considered boundaries are police beats and census tracts. Police beats are useful in that they are the organizational structure over which different policing factors will naturally be expressed. Census tracts, on the other hand, give us an insight into the characteristics of a neighborhood where a call originates and allow us to ask questions based on these neighborhood characteristics.
While some of the cities report the beat number or census tract ID for each call, others did not. To fix these gaps, we assigned each call a census tract ID and beat ID by doing a “point in polygon” join of the call location and the corresponding geographic boundary. For census tracts, we have used boundaries as defined by the 2010 US Census, and for beats, we’ve used the appropriate shapefiles provided by each city.
Bringing in Socio-Demographics
One of the benefits of aggregating to census geometries is that we can easily associate each call with the socio-demographic variables for that census tract by using the US Census Bureau’s American Community Survey (ACS) 5-year summary tables. In the final clean dataset, we have included the following characteristics by tract:
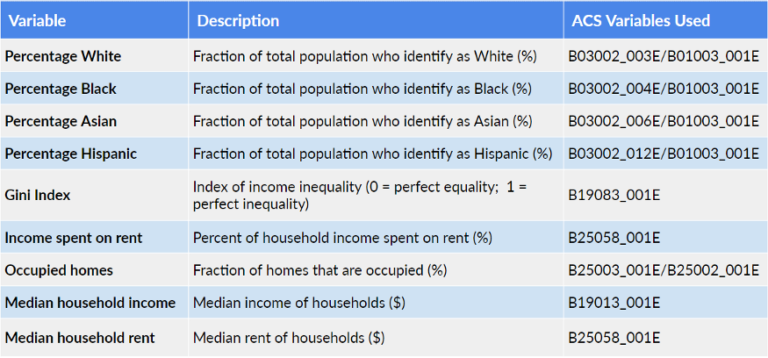
The ACS is a vast treasure trove of socio-demographic data. That said, the above is not intended to be exhaustive, but rather to offer a handy set of reference variables that we think are important to understanding the 911 data. If you want to add your own variables, we have provided the geographic ID the census uses to make joining with other tables simple.
One thing we have to be mindful of when using this data is how the census population differs from the call population. The census is sometimes referred to as a nighttime population, in that it describes the characteristics of people where they sleep (i.e., their homes). Calls that are made to the 911 system, in contrast, might or might not come from the same location where a person lives: calls might originate when the caller is commuting, or at work, or at a bar they like. In that case, it’s worth treating the socio-demographic data as information about the characteristics of the neighborhood where a call originated rather than inferring anything about the characteristics of the individual making the call or the person the call pertains to.
We can see a clear example of this when we map by census tract the number of calls per capita in New Orleans (Figure 1) and compare it to the census population for the city (Figure 2).
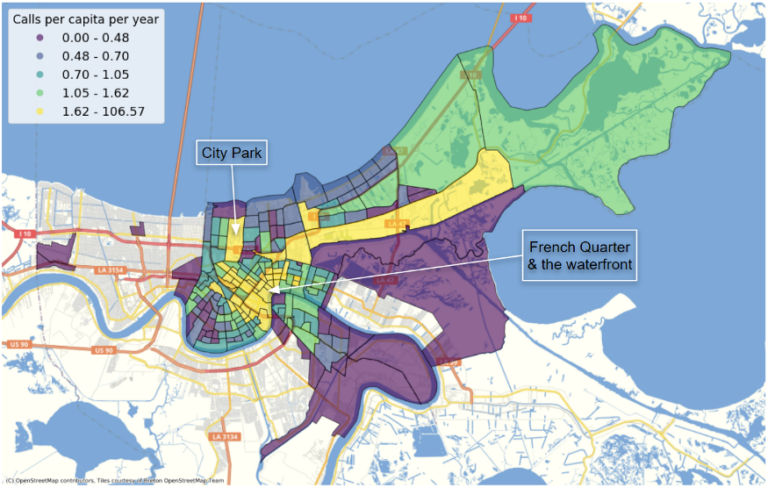
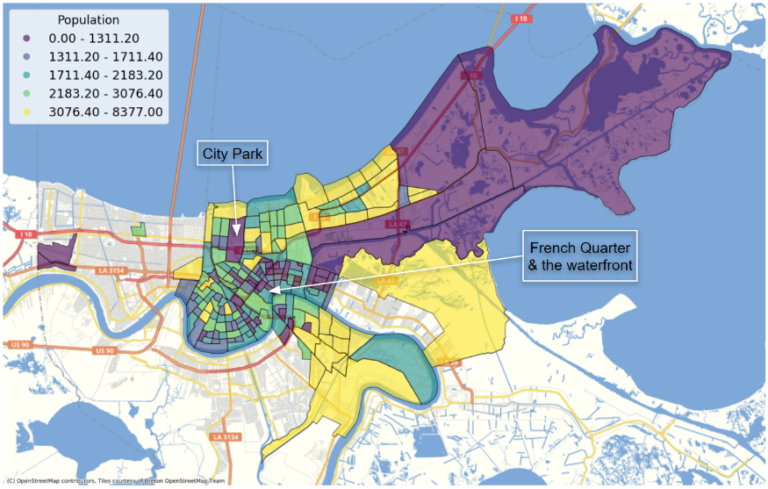
City Park, the French Quarter, and the nearby waterfront exhibit the highest calls per capita as demonstrated by yellow tract color in the map above. Considering that people (residents and visitors) spend a lot of time in these areas, we would naturally expect the volume of 911 calls there to be higher. However, the residential population in these areas is relatively low (as shown by the purple tract color in the population map below), making the interpretation of calls per capita different from areas with a larger population.
These kinds of issues make interpreting 911 statistics or building models using socio-demographic data more challenging. Thus, it’s worth considering precisely what a given variable is able to tell us, given its context, and how that relates to 911 calls.
Having both the socio-demographic variables and the call-aggregated variables allows us to start to compare call characteristics using neighborhood characteristics. For example, in the graphic below, we’ve compared New Orleans call characteristics (call types, source of the call, and call disposition/outcomes) for census tracts that fall within the highest 10% (right side of figure) and lowest 10% (left side of figure) of median household income:
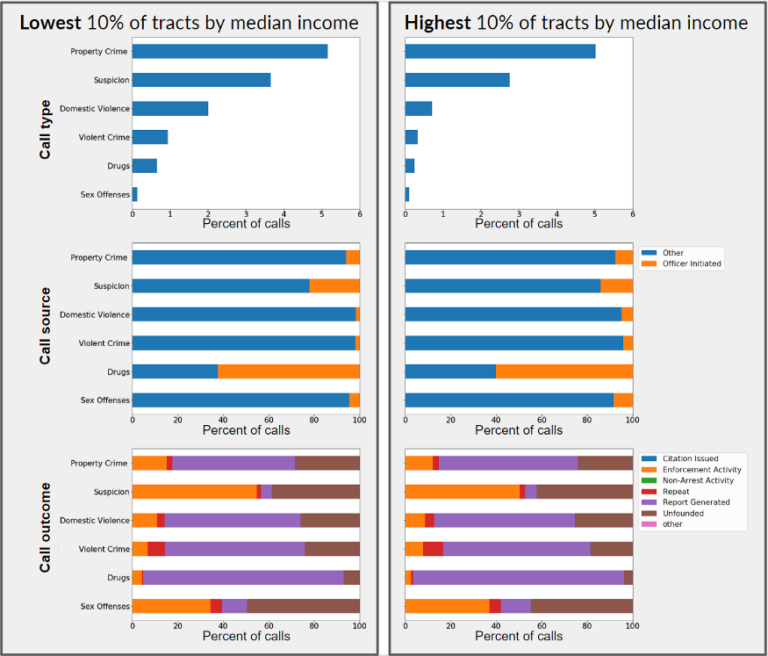
We might expect there to be large variations in 911 call types, sources, and dispositions across income levels, but the data seems to tell a different story. Although there are a few differences—lower income tracts appear to have a higher percentage of calls related to suspicion, domestic violence, violent crime, and drugs as compared to those with higher income — call patterns appear relatively consistent. There are a lot of interesting questions that can be explored when call characteristics are grouped by neighborhood socio-demographics. By cleaning, joining, and aggregating this data, we hope that those interested in further testing these hypotheses will be able to focus efforts on analysis rather than grappling to standardize the data.
Understanding Response Time and Temporal Patterns
We also want to standardize the temporal aspects of the 911 call data to better compare and understand differences in response time. A number of timestamps can be associated with each city, such as:
- The time the call was made
- The time an officer was dispatched
- The time that officers arrived at the scene
- The time that the call was resolved
Not every city has each of these characteristics, though we recommend that cities in the future include each individual timestamp. The most commonly available of these are the time a call was made and the time it was resolved.
We use these timestamps to add variables for the time of day, day of the week, week of the year, month, and year along with response time in hours to each of our datasets. A typical response time histogram looks like the following:
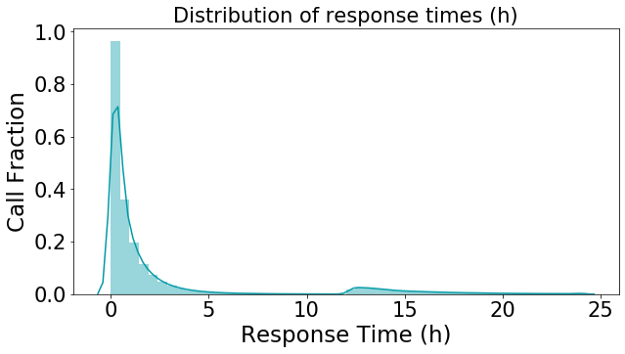
We have a large peak that decays exponentially from less than an hour to 5 hours. Note the second small peak around the 12-hour mark. We suspect the second peak represents non-urgent calls that arise late in the evening and are resolved the following day.
Conclusion
The pipeline we have built has yielded a dataset of 911 calls for each of our five cities (Charleston, Dallas, Detroit, New Orleans, and Seattle), with a standard typology including standardized geographies, temporal variables, and associated socio-demographic information. We have tried to make minimally biased choices for how to do this, consulting with Vera throughout, and have endeavored to make the assumptions at each step in our process clear. While we haven’t dug deeply into insights gained from the data in these blog posts, we intend to do so in a future series of blog posts. It is our hope, however, that others will find this dataset useful, along with the code that was used to produce it. We also want to put out a call for action to others to add more cities to the dataset we have curated. To do so, we have developed a modular ETL pipeline that anyone can contribute to on GitHub.
We have learned a lot throughout this collaboration and we appreciate the support, expertise, and efforts of the Vera team. We also hope that the challenges discussed and corresponding recommendations we have outlined in these blog posts might lead to, and ultimately facilitate, discussions about how local police departments and open data portals can coordinate to make the data they provide about 911 calls more transparent, consistent, and useful. We fully believe that the more we can understand about the 911 system, the more insights we as a community can produce to serve the needs of police officers and the public.