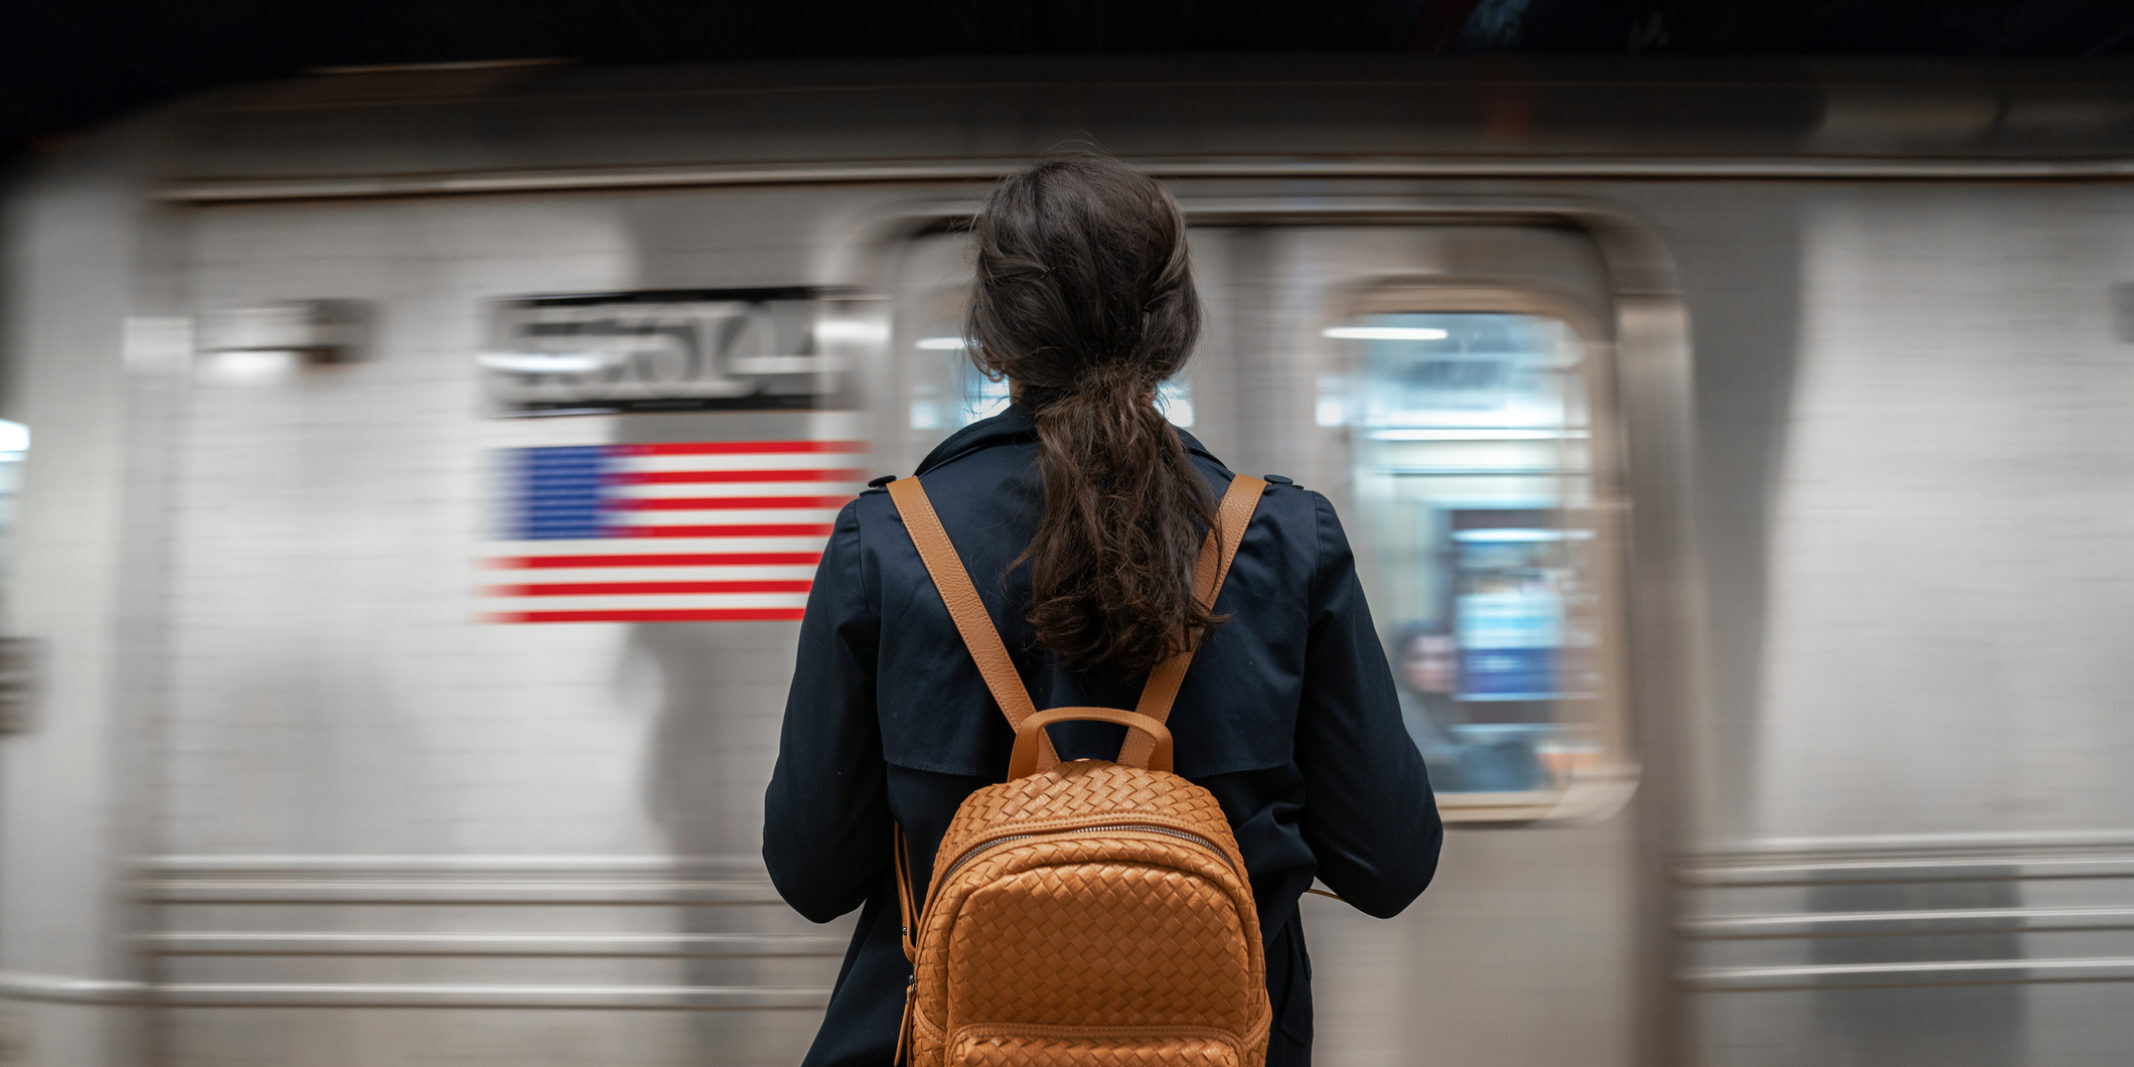
NYC’s subway system is the heartbeat of the city, shifting millions of people between their homes, schools, and workplaces each day. Although the pandemic has altered much of city life, the subway system continues to provide transportation to those who still need to go into work everyday. A few weeks ago at NYC Open Data Week, we presented our work on SubwayCrowds to estimate subway crowdedness. For the event, we put together the below visualization showing the average weekday ridership numbers since the start of the pandemic at different stops over the course of a day.
Each dot is a subway station and its color indicates ridership, with lighter red representing more people moving through the system at each stop. We notice that ridership starts increasing in the outer-boroughs relative to the rest of the city early in the day then moves into Manhattan. During the evening hours, we observe the opposite with these stations remaining more crowded until later in the day, indicating that more people from these communities are commuting home. Although this may seem intuitive, it demonstrates how commuters residing outside of Manhattan may face more congested commutes.
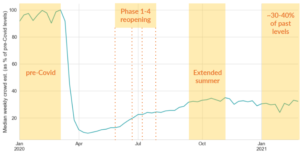
In addition, using our estimations, we can uncover insights into ridership over the duration of the pandemic. You may have come across charts like the one below showing the massive drop-off in NYC commuters over the last year. Ridership dropped by 90% as stay-at-home measures were announced in the second week of March last year. As the city started adjusting and recovering from the pandemic during the four phases of reopening in the summer, we saw ridership pick up again reaching about 30–40% of prior levels by October. Since then, these numbers have fluctuated around similar levels, with some drops during the weeks the city braced itself for snow storms.
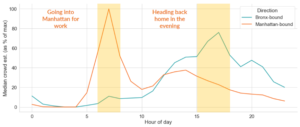
However, this chart doesn’t tell us the complete story of ridership on the subway. While overall numbers might be between 30–40% of pre-Covid levels, there is a lot of variability across different lines, particularly over the course of the day. Common commuting patterns remain, with many still needing to commute to and from work everyday during morning and evening rush hours. The chart below shows the relative estimated crowd on the 6 train for the last year by each hour of the day. We notice the higher peak in rider numbers going into Manhattan between 6–8 am and conversely in the Bronx-bound direction in the evening between 3–6 pm.
In summary, this data supports anecdotal evidence that potential crowding and its subsequent risks disproportionately impact commuters from stations in the outer boroughs. These communities tend to be areas with lower median household income, and may also be home to many essential workers without the option to work remotely.
For more insights into your specific commute, check out SubwayCrowds and let us know how well our estimates match up with your experience. If you’d like to contribute towards improving the methodology and uncovering further insights from this work, check out our work on GitHub.