In Short
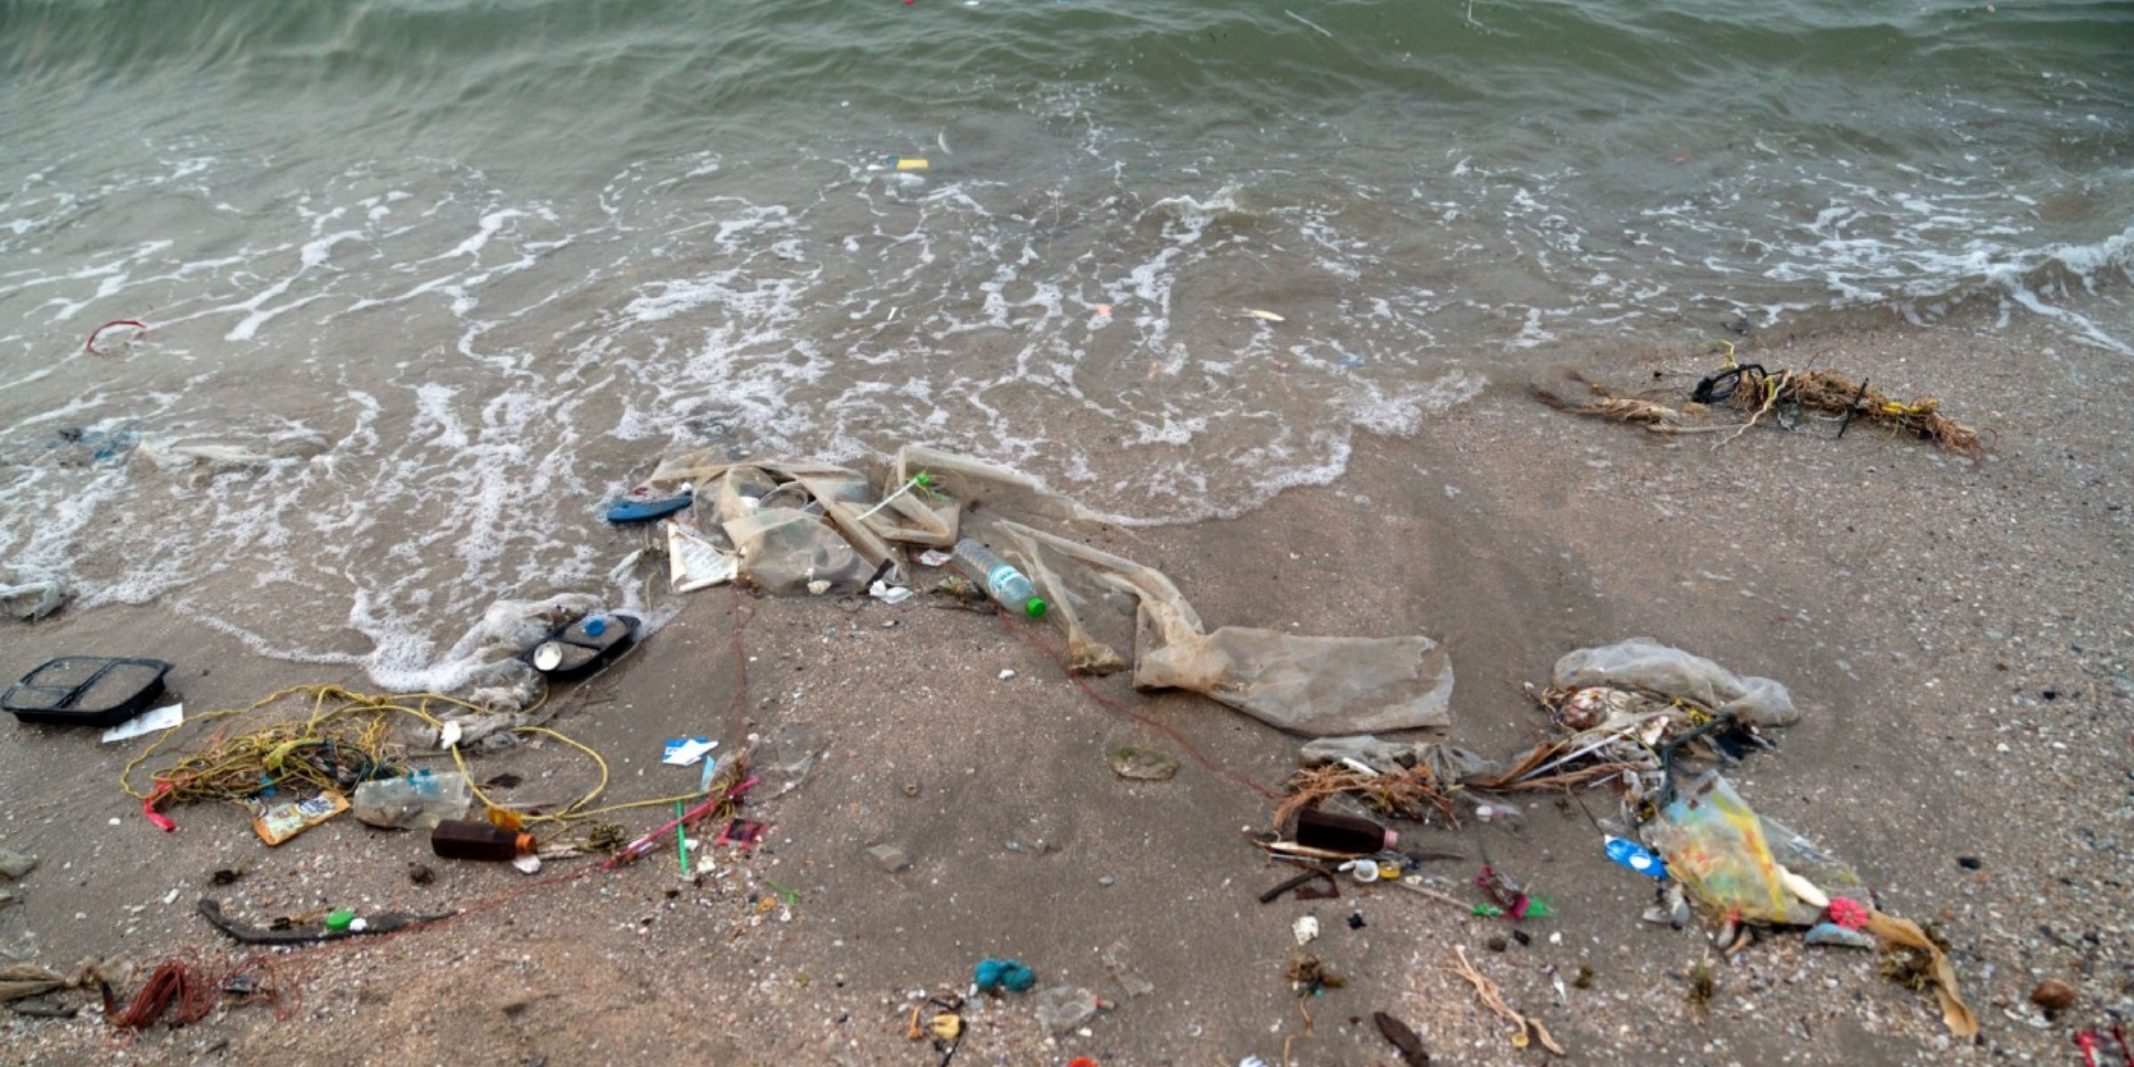
The world’s oceans are flooded with millions of tons of plastic waste each year, posing a massive threat to marine life and ecosystems, danger to food supplies, and devastating economic costs to communities that rely on tourism. Initiatives to clean up the plastic in the oceans are hindered by the scope of the search as well as the size of the problem. Given the vastness of the oceans, it can be difficult to correctly locate and identify plastic waste for clean up.
Satellite imagery combined with innovative modeling offered a partial solution. Data Clinic recently released an open source package based on EO-Learn as part of a collaboration with Plymouth Marine Laboratory (PML). It empowers researchers to identify potential macroplastics from Sentinel satellite images at scale. The approach and code was presented at 2020 SciPy, the recording of which can be viewed here.
The big problem with plastic
Plastics are everywhere. It’s hard to go through a day without using plastics; from toothbrushes to food containers and grocery bags, our lives are full of plastic. Plastic is durable, is easy and inexpensive to produce, and certainly adds convenience to our lives. However, these same properties result in serious, widespread environmental problems. Each year an estimated 8 million tons of plastic waste enter the world’s oceans through dumping or flooding. Considering ecological, social, and economic impacts, Nicola J. Beaumont and her colleagues estimate the economic impact per ton of marine plastic per year at up to $33,000 per year, putting the total cost of the problem somewhere between hundreds of millions and trillions of dollars.
Plastic waste can be categorized as “micro” or “macro,” depending on its size. Microplastics are no bigger than 5 millimeters. Macroplastics are bigger and are more clearly visible to the naked eye. But both micro- and macroplastics cause big problems in the ocean. Microplastics are easily ingested by fish and birds, and can end up in our own food supply. Macroplastics harm aquatic plants and creatures by becoming entangled with them or being ingested by larger creatures, and they can ultimately degrade into harmful microplastics.
In response to this cost, multiple international operations are underway attempting to remove plastic waste from our world’s oceans. But locating the plastic can be challenging. According to Lauren Biermann, earth observation scientist at PML, “[t]he exciting potential of this work is constrained by two factors. First, a lack of in situ validation data, but this is a common problem for remote sensing, and it’s largely outside of our control. Second, trying to detect floating plastics in satellite data is very much searching for ‘a needle in a haystack’ and it is often a laborious and computationally intensive exercise.” With so much surface area to cover, human-based surveys from boats or airplanes can only make shrimp-sized, localized dents in a whale-sized global problem.
A Celestial Viewpoint Sheds (Satel)lite
In 2002, researchers at PML in the UK decided to test if it was possible to detect macroplastics from a pair of satellites run by the European Space Agency. Known as Sentinel 2, these satellites orbit the Earth while continually taking pictures in multiple wavelengths. These satellites are ideal for this kind of task because they can create images of the same location on Earth every 2–3 days, with a resolution of about 10 square meters per pixel. Most importantly, they can measure the reflected light from the surface of the ocean not just in the visible spectrum, but also in the near and shortwave-infrared ranges. Clear ocean water efficiently absorbs light in the infrared part of the spectrum. But materials floating on the surface such as timber, macroalgae, and importantly our target — macroplastics — all reflect light in the infrared spectrum.
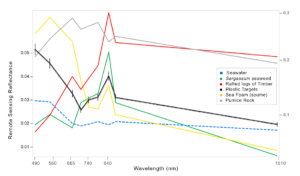
The PML researchers were able to exploit this contrast in reflection intensity to develop a method of detecting debris in the satellite images. Using a mathematical formula, they combined the contributions from various parts of the spectrum into a single number they could use as an index that measures the presence of floating material in a sentinel satellite image. Furthermore, by combining this new “floating debris index” (FDI) with the normalized difference vegetation index (NDVI), a metric that measures the presence of green vegetation, they were able to train a machine learning model to distinguish plastics from other types of floating debris.
This initial result was exciting as it had the potential to empower a global system of plastic monitoring. However, much of PML’s data pipeline remained a manual process, which made scaling up detection difficult and produced some unexpected results when applied to new scenes. In early 2020, We partnered with PML to explore this approach in more detail in an effort to reduce the number of false positives and to help take their plastic detection pipeline from proof of concept to a robust, repeatable workflow.
Scaling the Analysis Using EO-Learn
PML’s initial workflow for identifying plastics in Sentinel images was manually driven, requiring the researchers to spend many hours looking through huge image files to identify large-scale features such as fronts and eddies that might contain aggregate macroplastics. Once they found a likely candidate area, they painstakingly inspected each promising pixel for the signature of plastics and other debris. While this method produced some likely candidate pixels in regions that were known to have macroplastic outflows, it couldn’t scale to meet the demands of detection at a global scale. Our first task was to build on the pioneering work initiated by PML and use it to create an automated pipeline that could increase their ability to scan a large target area.
To accomplish large-scale automation, we used an open source python package called EO-Learn, which combines data science and earth observation to enable researchers to create composable, sharable analysis blocks that they can arrange into more complicated workflows. Given a large region of the planet and a time range, EO-Learn identifies the relevant Sentinel satellite passes and then segments these massive images into multiple smaller regions called EO-Patches. These patches can be processed through a series of reusable, composable EO-Tasks such as cloud-detection and land/water segmentation. However, to suit this use case, we wrote several new EO-Tasks, including one to calculate the FDI defined by the PML team and another to train and apply the machine learning model we created. The EO-Patch abstraction empowered us to easily parallelize the processing of a scene and work with each subregion as a simple set of 2D NumPy arrays.
Having each step of the process automated in an EO-Learn pipeline enabled us to apply the processing at scale to large regions. With our first prototype implementation of the workflow trained using the dataset of sample pixels PML had compiled, we were ready to try it out on a new region off the coast of Scotland.
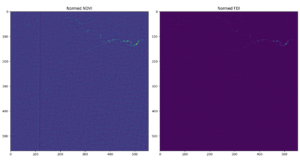
The results were, well, not as accurate as we had expected based on the test data. The image below on the left shows a visible-light image of our test region, and the image on the right shows the classification label that the model assigned to each pixel.
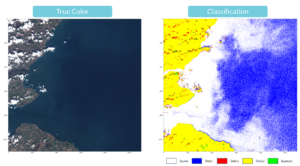
While many of the open water pixels are correctly identified as such by the model, the lighter colored water near the coastline was mislabeled as spume, the froth or foam found on waves. While we would expect to find some spume in this region, the model is clearly mislabeling a lot of water pixels as spume. This was a clear sign that something was wrong with the model but what exactly it was remained unclear.
Data-Driven Atmo-Correction
As the PML study was one of the first to identify plastics, or indeed any debris, in the oceans from satellite imagery, they had very few samples of ground truth to work with. To produce a training dataset, they had to first identify likely candidates of each label from reports of known plastic outflowing events that had been reported in the news or on social media.
This means that many of the samples of plastics we have to work with come from the same location, frequently originating from the same Sentinel satellite pass. At first, this fact didn’t seem to matter. However, when we consider that the reflected light in our Sentinel pixels is not just pure reflectance from the macroplastics, but rather a mix of the plastic, the surrounding ocean water, and other materials including the atmosphere between the water and the satellite, it becomes clear the issue is more complicated.
These other materials likely vary across space, which means that a model trained in one location may not accurately classify images in another. For example, if the water in a pixel happens to have a different spectrum compared to the region that the model was trained on, it might shift the FDI vs NDVI relationship and lead to pixel misclassification, as occurred in the Scotland example above. Often, an atmospheric correction can be applied to images to account for this localized variation; however, most of these methods are designed with land-based use cases in mind. For the detection of floating debris on the surface of the water, this type of common correction leads to inconsistent results and may even remove some of the infrared signals we are relying on to detect the plastics.
Ideally, the solution to this problem would be to collect many more samples of plastics and other floating debris to train a more robust model; however, given the relative newness of this research and the needle in a haystack nature of finding candidate pixels, this approach is impractical. Instead, we developed a data-driven approach to removing inconsistencies from the data.
If the condition of the water and the atmosphere vary over an image, it’s challenging for the model to establish a baseline with which to compare the plastic candidates with empty water. Instead of trying to use a physically correct model to compensate for this missing piece, we can try to measure these effects in the vicinity of the candidate pixel and adjust for them. The key idea here is that most pixels in any part of an image should be water without any debris. So if we take the average properties of the reflected lights over a large enough window around each pixel, they should be close to what we expect water to look like. We can then subtract these average values off the central pixel, creating a standard baseline.
Applying this approach to the NDVI index we can see that it helps flatten the background signal so that the contrast between floating debris and seawater becomes much more apparent.
We can also see the effect this method has on the FDI and NDVI values, which are two of the most important features the model uses to distinguish between categories.
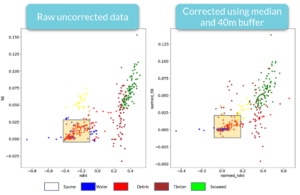
We created this normalization step as an EO-Learn task, added it to our processing pipeline, and retrained the model using the same training data. On our test dataset, it achieved a precision (the number of plastic pixels that were correctly identified as plastic pixels) of around 88% and a recall (the number of known plastic pixels that were identified as plastic) of about 42%. While this recall number is lower than we would like, we care much more about having high confidence in the identification of plastic pixels we do find as opposed to false positives, since finding plastic ultimately helps us build up more confirmed examples of plastics.
“[…] [W]e’re starting to see the ways we can do this work reproducibly, and at pace. [Data Clinic’s] automated methods very nearly matched the precision we got when we picked each pixel by hand, which bodes incredibly well for the future of marine plastic monitoring!” -Biermann.
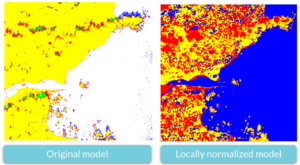
What’s even more important is that when we apply the new model to the same region of Scotland, the issue we saw with the misclassification of water to spume is now resolved.
What’s Next?
Now that we have an automated workflow and a model that is robust to varying conditions, we can start to apply it to different previously unclassified regions to detect plastics. The next step for the project is to build up a larger library of example pixels. To do this, we plan to use the model to identify candidate plastic pixels from a wide range of different locations, have these labels vetted by the experts at PML, and then use them to train a more robust model.
Our hope is that in the future, this monitoring capability will be a critical tool to aid in both remediation to remove existing ocean plastics and monitoring efforts to reduce new sources of pollution. To this end, we open sourced the core pipeline for the project, which is available in our Github repo. We are always looking for ways to improve; feel free to contribute or contact us at dataclinic@twosigma.com with your feedback and suggestions. If you are interested in learning more about this project, check out the video from SciPy 2020 where we presented this work with collaborators from PML.
A special thanks to PML for their collaboration and to Laura Mahalel for her help editing the blog.