
Increasing Access to Open Data Insights
Data Clinic has supported social impact organizations using different open data sets to help predict oil and gas well violations and to investigate reporting discrepancies on school bullying. Through these and other projects, we have seen first-hand the power of open data to provide valuable insights for organizations that may not have the capacity to collect data on their own.
However, despite the potential of open data, common challenges remain relating to the immense effort and expertise it requires first to navigate the world of open data and then to transform data into interpret-able takeaways. While many people and organizations are using this incredible resource, there is a general lack of knowledge-sharing across sectors on how best to remove barriers to entry and leverage open data, especially for those with limited technical experience.
To fill this gap, Data Clinic set out to develop a suite of open source tools with the aim of inspiring individuals and organizations without in-depth data expertise to use open data to visualize patterns, glean insights, and further data-driven work. The first such tool is NewerHoods.
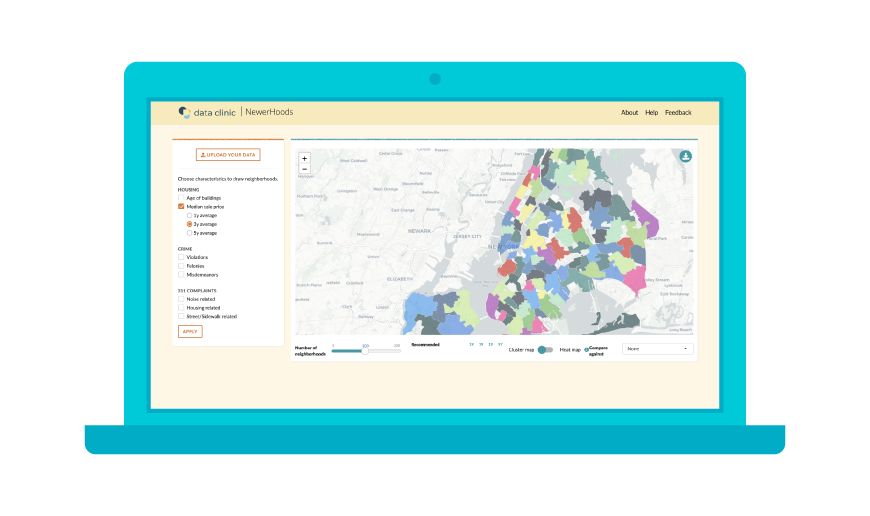
NewerHoods is an interactive web app that uses machine learning to generate New York City (NYC) neighborhood clusters based on user-selected features. You might be wondering why neighborhoods are important and why they need to be redefined?
NYC’s neighborhoods are a driving force in the lives of New Yorkers — their identities are closely intertwined and a source of pride. However, the history and evolution of NYC’s neighborhoods don’t follow the rigid, clinical lines of statistical and administrative boundaries that are often used to identify them. There are many definitions of a neighborhood and below we summarize the most common.
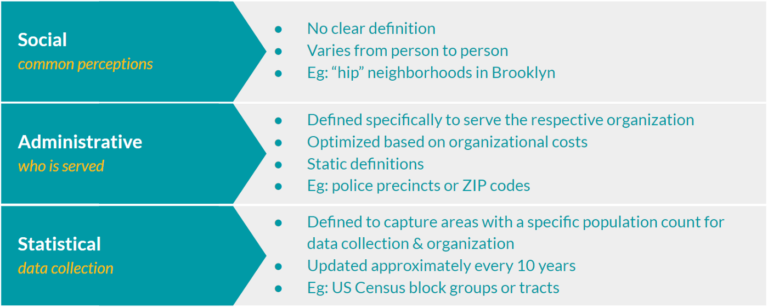
Current definitions of a neighborhood originate for a specific purpose, and it does not always make conceptual sense to view the city through the lens of these predetermined divisions. Instead, the neighborhoods we live and work in are the result of a more organic confluence of factors and will differ according to use case: Are you interested in identifying the next hip area? What about identifying environmental burdens?
If we think that a neighborhood demarcates an area that shares common traits, then how we define that boundary should depend upon the characteristics of interest. For example, if we are trying to identify up-and-coming neighborhoods, we might look at rising real estate prices and an increase in local amenities, such as breweries and artisanal food options. Similarly, families with young children might be interested in communities with access to parks, good schools, and child care. These specific neighborhood identities are not likely to coincide with ZIP codes or community districts; communities are constantly evolving, while administrative divisions remain static over time.
Below is a map depicting different NYC administrative boundaries. It’s hard to see much given there are so many types and they are not nested. It’s likely that you and your neighbor across the street reside in a different combination of administrative boundaries even though you are considered neighbors.
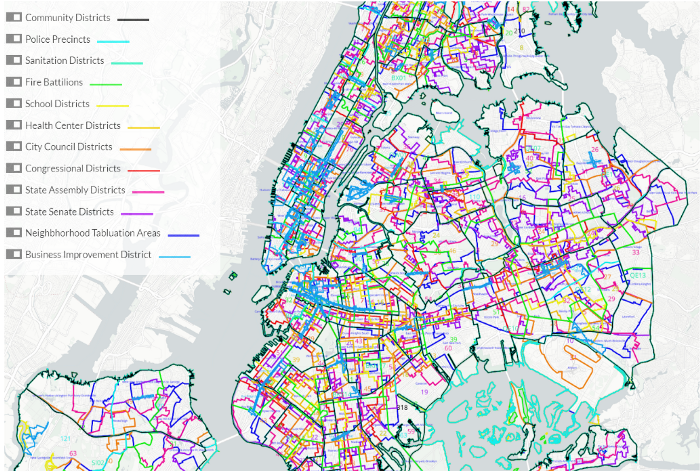
From a statistical standpoint, grouping and analyzing data at these administrative boundary levels may not be ideal. For example, one community district may contain a lot of variety in say, real estate prices. However, visualizing real estate prices averaged over the district would hide that variety — each area would be represented by one value, thus obfuscating any underlying local patterns.
By dynamically defining neighborhoods to be homogeneous in their characteristics, statistical modeling and analysis are likely to be more nuanced and contextually rooted in what the user cares about. Given the conceptual and statistical benefits to using a data-driven approach to identifying neighborhoods, NewerHoods was developed to be responsive to the specific needs of users.
A Unique Spatial Clustering Challenge
The methodological approach of NewerHoods consists of three steps. We started by gathering data-sets from the NYC Open Data portal, selecting a variety of data relating to real estate sales, crime rates, and 311 noise complaints. We chose data based on completeness, coverage, and our own interests, but a central aim of NewerHoods is to enable users to upload their own data. To learn more about the data cleaning and merging process, please visit our GitHub repository.
Once the data was cleaned and processed, the next step was to aggregate it into features or attributes at the census tract level. We chose tracts because they offer a balance between granularity (tracts are pretty small) and data completeness. Lastly, tracts were clustered by features to define homogeneous neighborhoods.

Clustering is an unsupervised machine learning method most commonly used to find hidden patterns or groupings in data. Since a neighborhood is essentially a group of tracts sharing similar attributes, we used clustering to find these natural groupings. While this might sound straightforward, traditional clustering algorithms do not take into account geography, instead focusing exclusively on the feature (data) space. In our case, we sought to identify neighborhoods that were not only similar in features, but also contiguous in a spatial sense. This imposed a restriction — clustered tracts needed to be connected to each other, and thus required moving beyond feature clustering. We accomplished this by using a spatial hierarchical clustering algorithm¹.
As shown below, we began by assigning each census tract to its own cluster, and then combined two of these clusters together at each iteration step until we were left with one single cluster. We sought to minimize within cluster variation at each step so that only the two most similar clusters were combined. The optimum number of clusters can be determined by user selection or empirically, by metrics that quantify the homogeneity of the features in each group. For code and more information on the algorithm and methodology, see our GitHub repository.
The current version of the tool allows the user to select from a set of features or upload their own data, vary the number of clusters to observe, compare against some of the existing administrative boundaries, and toggle between cluster map and heat map visualizations.
The Evolution of NYC’s Five Boroughs
To give users an example of the kind of insights that can be gleaned from NewerHoods, we asked ourselves — can we redefine NYC’s five boroughs based solely on data? Ever since its consolidation in 1898, NYC has been known by its five boroughs: the Bronx, Brooklyn, Manhattan, Queens, and Staten Island. This division has influenced many things, but none more so than real estate.
Lower and mid-Manhattan, the city’s business center and central hub, have always been some of the most expensive real estate regions of the US. Housing prices decrease the farther away you move from Manhattan, influenced in part by limited connectivity between the boroughs. However, over time the city and its transportation networks have evolved, and we wondered if the real estate market of today would reflect NYC’s growing decentralization.
Selecting “Median Sale Price” as the metric of interest and choosing a 5-cluster solution, we used NewerHoods to redraw NYC into 5 distinct clusters — our revised 5 boroughs — as reflected by the real estate market today. As shown in the map results below, clustering on sale price preserves Staten Island and the Bronx, but the other boroughs are no longer the same.
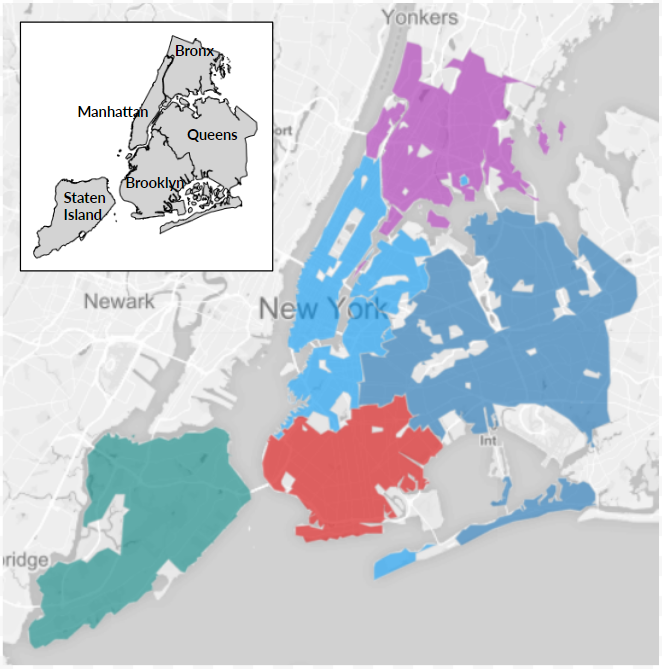
One major change occurs in the strip running along the East River through Brooklyn and Queens. This region is almost a “second” Manhattan, which has seen a tremendous rise in real estate prices over the years. While this might seem somewhat obvious to anyone who has tried to buy or rent in NYC, NewerHoods enables us to quantify this information and cluster these areas according to their similarity as opposed to predetermined boundaries.
In this example, the “double Manhattan” cluster has a median sale price of $870 per square foot, more than double that for the remaining parts of Brooklyn and Queens, which average $390 and $330, respectively. Median price per square foot is even lower in Staten Island ($290) and the Bronx ($210).
This is just one example of the kinds of exploration one could carry out using NewerHoods, and we hope to compile user stories and learn more about how this tool might help you in your work. Watch this space for regular updates from us on different applications of the tool, feature updates, and ways to get involved. We’d also love to hear from you — please share your suggestions for other features or data-sets to include in NewerHoods. You can do so by connecting with us via NewerHoods’ GitHub repository or emailing us at dataclinic@twosigma.com. If you’re a developer, we’d love to have you contribute as well.