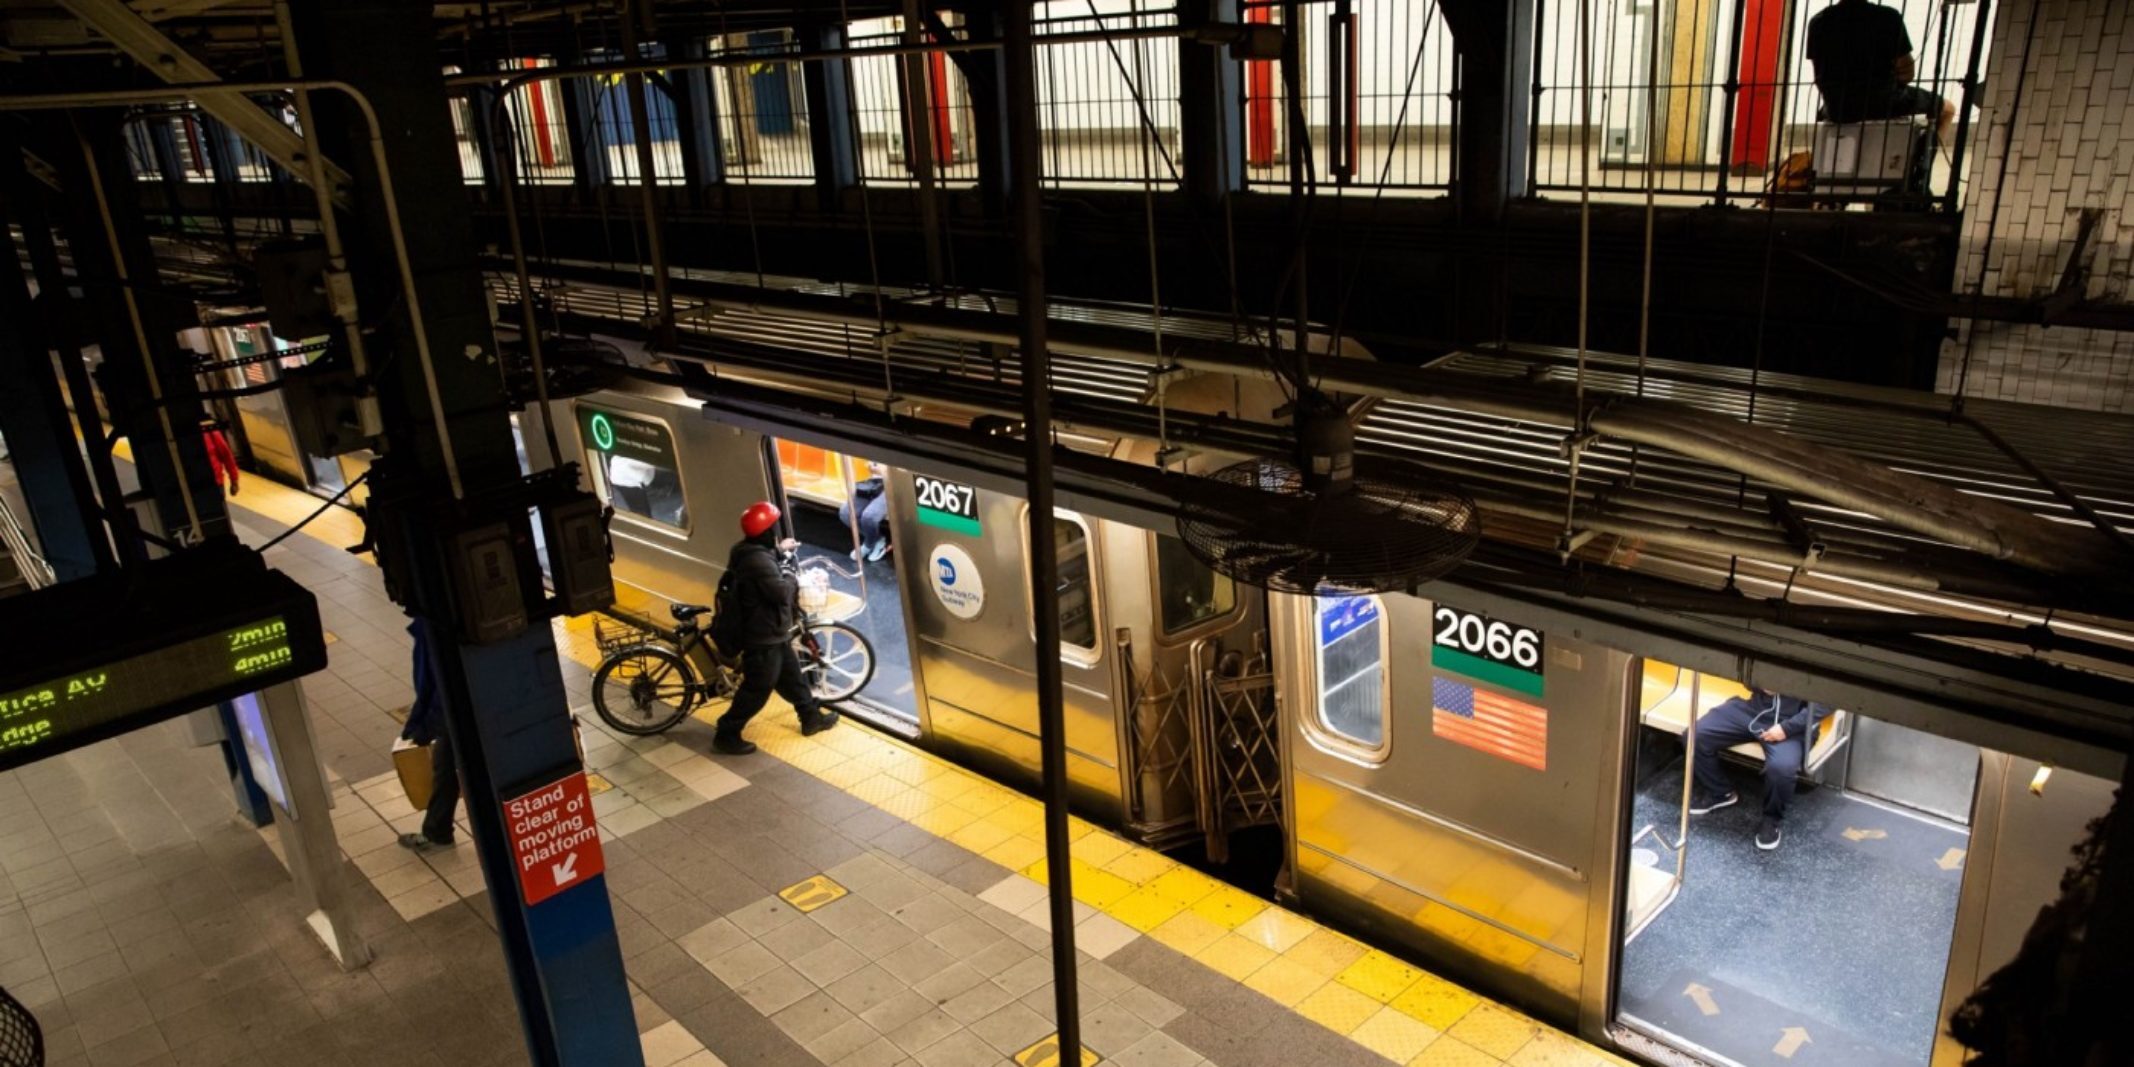
We are now close to a year into a global pandemic that has upended and altered everyday life. As one of the first COVID-19 epicenters in the US, New York City has been in the spotlight, first in trying to contain the spread of the virus with various restrictions on movement, and now with the easing of these measures to regain some semblance of normalcy. The subway system has not been immune to these changes — with scheduling weaned down to essential service and record lows for ridership — and data enthusiasts have taken notice (I Quant NY, QRI, CityLab).
As the city continues to adjust, more people are heading back into work and some students are attending colleges or schools in-person. A central question on many minds is how exactly this will all work given NYC commuters reliance on public transportation. Is it possible to safely and effectively move so many people while maintaining social distancing?
According to a recent New York Times article on subway ventilation systems, “if more people begin riding the subway, pushing crowding closer to pre-pandemic levels, the ability of the system’s ventilation to lessen the risk of viral transmission diminishes dramatically.” This challenge got us thinking about open data and whether it could be used to measure crowding in the subway system.
Having recently released a set of data products from our NYC subway accessibility project, including cleaned and interpolated hourly turnstile data, a subway network map, and a crosswalk that joins subway stations, equipment, turnstile data, and General Transit Feed Specification (GTFS) data, we turned first to these sources. We envisioned an app that provided the city and commuters some way of understanding how crowded their route might be from the perspective of an average subway car. The goal would be to identify when train cars in a specific route were likely to be most crowded so that individuals might alter their travel time or trip if possible.
While Google Maps currently provides estimates of how crowded subway stations and other locations are compared to historical levels, using mobile location data as a proxy, we felt developing an open-sourced methodology that uses publicly available data from the MTA directly related to subway usage would add value to the space. Additionally, our approach presents crowding estimates on an individual trip basis rather than for entire stations, making it easier for users to consume and utilize this information in planning their commute.
Methodology
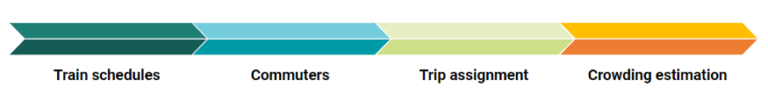
The task of estimating the crowdedness of a train sounds straightforward, yet it is anything but, especially given the limitations of publicly available data. The methodology we adopted to approximate crowdedness can be broken down into four steps as illustrated below.
Train Schedules
One of the two key pieces of information needed to estimate crowding comes from the real-time GTFS data feed. This data provides the arrival time at a stop for each active train in the subway system. We pull in this data every few minutes and perform some processing such as filling in the starting stops and times, excluding trips with significant incomplete information to get clean data for trips by each train.
Commuters
The other key dataset is the Turnstile usage data that provides the approximate number of people using the subway. This data, released weekly, provides an aggregated count of the number of people entering and exiting a given station for a four-hour period. Unfortunately, this data isn’t released at a high enough resolution to input directly into our analysis so we apply a time-series technique of interpolation to get estimations of the number of people at a station at every minute of the day.
Trip Assignment
Next comes the challenging task of figuring out which train a commuter is likely to take by answering questions such as “how likely is an average commuter at Times Square to take the uptown R train versus the downtown 1 train.” With no data available for individual commutes, we instead employ a heuristic approach. To do this, we start by looking at the total number of exits at the stations along each route at each hour as this tells us where people are commuting to. The proportions of these exits for all of the different routes serves as the proxy for the likelihood of a commuter choosing one route over another.
Crowding Estimation
Lastly, we bring all of these pieces together. When a particular train arrives at a station, we have the number of people waiting at that station and subsequently how many people are likely to board this particular train. Coupled with information on the number of people likely exiting from this train (using the station exit data), we are able to estimate the crowdedness of the train at this stop. We then average this metric for each train-station-time over a two-week period to generate a smoothed average crowdedness at each hour for all the lines along their respective routes. Due to differing commuter patterns, weekdays and weekends are treated independently.
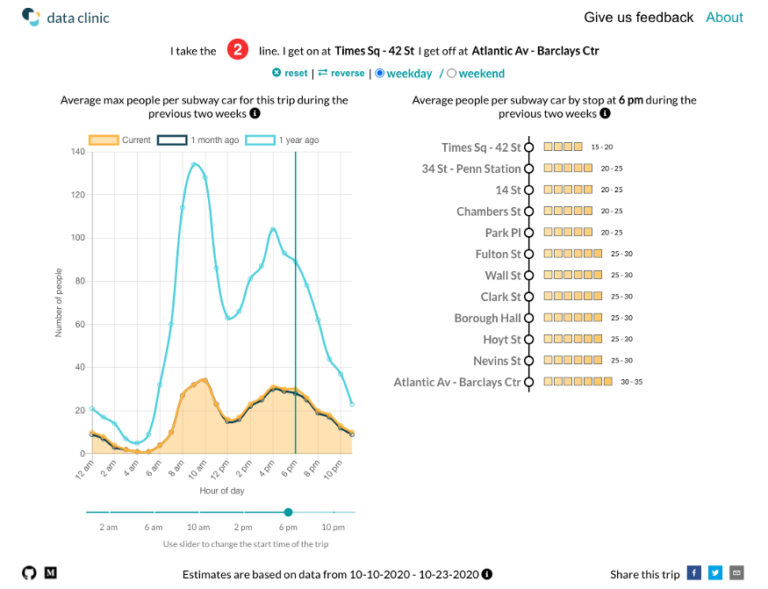
With the data pipeline completed, we built an interactive web application, SubwayCrowds, to display the data (see screen grab below). Users select their trip of interest (subway line, start and end station) and can then explore the crowdedness of each station and hour along the journey. The chart on the left shows the estimated maximum number of other commuters you are likely to encounter in an average train car for the chosen trip starting at different times of the day. The slider along the bottom of the left chart can be used to display the approximate number of people in an average train car for that time of day along the route (right chart).
We’ve done our best to provide an accurate metric for train crowdedness, but there were a lot of assumptions made in the process. We welcome the opportunity to improve this methodology and invite you to check out SubwayCrowds and its repo for more information and source code. Reach out to dataclinic@twosigma.com to let us know if you have any feedback on the tool or the estimates.