
Two Sigma’s Data Clinic team, in collaboration with Bridging Ethnicities at Two Sigma (BE@TS), an employee resource group, organized a Hack Day in June 2022 with a theme of Equity and Inclusion. In honor of Juneteenth, the oldest nationally celebrated commemoration of the ending of slavery in the US, we organized a day-long event to advance learning, action, and allyship through discussions, presentations, and initiating projects that utilize Two Sigma’s vast Data Science and Engineering skill sets. In this post, we will go into more detail on one of the projects that focused on the racial history of homeownership. In particular, we tried to advance our understanding of the present-day extent of racial disparities in homeownership using publicly available data on mortgage applications.
A Racial History of Homeownership and economic opportunity
Although homeownership is an effective way to build wealth – indeed, a “cornerstone of the American Dream” – not all Americans have had equal access to this pathway to economic empowerment. Among the reasons for continuing racial disparity in homeownership rates are certain historical practices that in some cases continue to this day. Examples of such practices are “redlining”, “blockbusting” and “racial steering”:
- Redlining occurs when either a bank, mortgage lender, or a government agency provides different levels of service to different neighborhoods based on the race or ethnicity of its residents. For example, a bank may offer fewer and less favorable mortgages to ethnic minorities.
- Blockbusting occurs when real estate agents or developers convince White homeowners that local property values will plummet following the influx of members of a different socioeconomic class, racial, or ethnic group. Such messaging from these “blockbusters” contributes to the phenomenon of “White flight”, wherein White homeowners are pressured to sell their homes at low prices. These homes are often resold at inflated prices to Black, Indigenous, and People of Color (BIPOC) residents.
- Racial steering occurs when real estate agents “steer” clients from different backgrounds (also known as “protected classes” under the Fair Housing Act of 1968) toward certain neighborhoods or away from others, either by advising them to buy a house in one area, or by failing to show them or tell them about houses in other areas that fit their needs and budgets.
In spite of certain positive changes brought about by the Fair Housing Act of 1968, congressional hearings in subsequent years revealed a continued shortfall of credit in urban communities, which in turn negatively impacted homeownership rates for non-White residents. Congress consequently enacted a number of fair housing efforts, including the Home Mortgage Disclosure Act (HMDA) in 1975 to ensure that communities were not denied access to lending according to location. HMDA requires certain financial institutions to report information about mortgage applications and originations (the process by which a lender works with a borrower to complete a mortgage transaction, resulting in a mortgage loan), which helps researchers, activists, and policymakers investigate disparities in home mortgage applications across time, geography, and demographics.
Our work
As part of Hack Day, a quarterly internal hackathon organized at Two Sigma, we set out to investigate the data published under the HMDA and understand the state of racial equity in US homeownership today. Volunteers across Two Sigma collaborated to gain a deeper understanding of the levels of racial disparity in access to mortgages, as well as some of the implicit costs that BIPOC communities face throughout the mortgage application and approval process.
Recent reports, such as one by the Consumer Financial Protection Bureau (CFPB), that analyze and summarize high-level trends in mortgages, indicate higher denial rates for Black and LatinX applicants, versus White applicants, across different types of mortgages. Several studies on the implications of systemic injustices also show that the average Black mortgage applicant has an economic profile that differs from their White counterparts in terms of their income, debt, and the kind of housing sought, which could significantly influence the outcomes from these applications.
The goal of our analysis was therefore to understand whether mortgage outcome disparities experienced by BIPOC communities are fully accounted for by differences in such objective characteristics present in their mortgage applications – and, if not, to understand how the outcomes vary after accounting for these characteristics. In simpler terms, we hope to estimate the differences in outcomes, on average, if we were to compare two groups similar in all other observable characteristics except their race or ethnicity.
HMDA data
The data consists of millions of mortgage applications reported by over 6,000 financial institutions. These are de-identified and aggregated to protect individual privacy by the Federal Financial Institutions Examination Council (FFIEC) and made available to the public. The information available for each application can be broadly grouped into (full details provided in HMDA Data Documentation):
- Applicant demographics (age, race, ethnicity, gender, etc.)
- Applicant financials (income, debt, etc.)
- Location/neighborhood characteristics (high/low income neighborhood, minority %, owner occupied units, median age of housing, etc.)
- Property characteristics (value, type, unit, construction method, etc.)
- Loan details (loan type, amount, purpose, term, etc.)
- Outcomes (action taken, interest rate, rate spread, origination costs, etc.)
For this work, we limited our analysis to conventional home purchase loan applications from 2018 to 2021 by individuals for their principal residence. We also excluded reverse mortgages, open-end line of credit applications, and business or commercial loans. To understand the relationships in this data, we modeled the outcomes using the relevant set of information available about the applicants and the mortgage application. Although the data contains granular geographic information, our analysis focused on state-level differences and is limited to variables that are most consistently available in the data.
Examining drop offs in the Mortgage application process
While much of the research surrounding this topic reasonably focuses on mortgage application denial rates, lender denials are only one of several possible reasons for an unsuccessful application. In summary, a mortgage applications could be unsuccessful for any of the following reasons, each of which occur at different stages of the mortgage seeking process:
- Withdrawn by the applicant
- Remains incomplete
- Denied by the lender
- Not originated due to terms unsuitable to the applicant
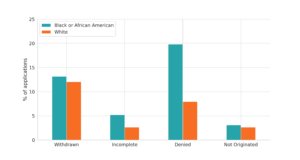
The chart above illustrates variation by race across negative outcomes of a mortgage application. What we observe is that while the largest disparity occurs in the approval stage of the application, there are evident disparities at each stage of the process. For example, Black applicants are more likely to also withdraw and/or not complete their application. While we continue to focus on studying the differences in denial rates of applications, we are developing this work in a way that would enable us to dive deeper into studying the relationships at other stages of the process as well.
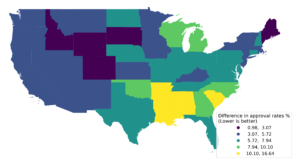
We modeled the likelihood of mortgage application approval in each US state across three years of data (from 2018 to 2020), controlling for certain applicant demographic and economic characteristics, as well as neighborhood factors from the US Census. Overall, these models captured more than 50% of variance in the approvals for most states. This suggests that these characteristics can explain over half of the approval results in spite of the limited data available for each application. The results show that across the US, Black applicants are on average 7% more likely to be denied in their application compared to White applicants but these differences in approval rates vary significantly across the country as shown in the map above. Furthermore, our analysis indicates that for desired houses in comparable neighborhoods, Black applicants in southern states are, on average, 10% more likely to be denied mortgages compared to White applicants with similar socioeconomic characteristics (i.e. gender, age, income, debt). We observe smaller, albeit meaningful, differences in racial outcomes in the northeastern and western states, where approval rates for Black applicants are 3-5% lower than rates for White applicants.
Our analysis of other variables in the model yielded a number of other interesting findings. We noticed that younger applicants (25-35 yrs old), applicants with higher incomes, and applicants with lower debt-to-income ratios (<50%) were more likely to be approved, which might agree with our intuition. LatinX applicants also saw lower approval rates (~2% on average), while Asian applicants had a <1% difference in approval rates compared to White applicants. Such analyses confirm insights derived from high-level trends and broadly available summaries of this data, and more importantly provide better estimates of these differences by controlling for many observed factors.
How much added costs do Black homeowners incur?
Getting approved and originating a mortgage is a major step towards homeownership, but this is also the beginning of a several decades-long journey paying it back. The HMDA data includes several data points related to the costs involved in the approved mortgage application. The three summarizing variables here are:
- Rate spread: difference in APR for the mortgage vs. a comparable average prime offer rate at that time.
- HOEPA Status: a holistic categorization of whether the mortgage can be considered high-cost based on rules of the Home Ownership and Equity Protection Act.
- Total loan costs: combination of several different fees such as origination charges, total points, lender credits, and discount points.
While HOEPA status is the most general classification, we found very few loans in the data were actually classified as high-cost. Instead, we focus on rate spreads to start and hope to incorporate other costs into the analysis at a future point. While the upfront costs may be a massive burden to applicants, we estimated that over the term of a loan, increased payments associated with higher rates often outweigh these costs. We employ a similar analysis framework as previously laid out with this sample restricted to approved applications.
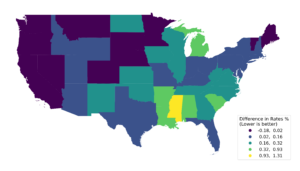
From this preliminary analysis of data for three years (2018 to 2020), we observe that Black applicants on average are offered ~0.2% higher interest rates compared to White applicants after controlling for other factors such as their age, gender, income, debt, and neighborhood characteristics of the property. While these differences seem quite small looking across the country, there is significant variation between states with the difference in offered rates ~1% higher in the southern states, for example. Also, to add context to these differences, a 0.5% higher mortgage rate roughly corresponds to 10% of the loan value being paid in additional interest over a 30 year loan term. So, even these apparently small differences in rates have the potential to significantly limit the spendable income of Black homeowners.
In terms of other demographic characteristics included in the model, we noted that young homeowners (<25 yrs old), and LatinX applicants were also offered higher rates on average while Asian applicants had slightly lower rates compared to middle-aged White applicants. Applicants with higher debt (>50% debt-to-income ratio) had higher rates, and those with higher incomes were offered lower rates, on average, as expected. While these findings are insightful, it is important to recognize that these are preliminary results based on a limited set of information available for each application. In particular, the model used in this analysis was only able to capture a small fraction (10% R2) of the observed variation in offered rates, suggesting that more data on applicant/application characteristics are needed for more robust insights into the differences in offered rates.
Summary
Our goal for this analysis was to get a deeper understanding of the differences in mortgage application outcomes between Black and White applicants after accounting for certain demographic and socioeconomic characteristics and study how these vary geographically.
Our analysis suggests that, compared to similar White applicants, Black applicants were more likely to be denied mortgages with varying rates of disparity across different states. Furthermore, our data show that Black applicants who received mortgages were generally offered higher mortgage rates in some states compared to white applicants. It is important to note that our analysis is not sufficient to suggest that systemic racial bias is the cause of the observed disparities. What we can conclude is that the differences in outcomes for Black applicants could not be explained by variables included in this model.
In spite of the meaningful differences observed in outcomes for Black and White applicants, we acknowledge that our analysis was subject to certain significant limitations related to data availability: lack of available data on applicant credit scores; incompleteness in the property value data, and limited data on characteristics of mortgage providers. All of the foregoing data could have been relevant to our stated goal and would likely have improved our estimates of racial differences in mortgage outcomes.
It is our hope that the results of this analysis encourage further detailed research into the topic of racial disparity in homeownership. A more granular analysis at the county-level, for example, could potentially unearth valuable insights not apparent at the state-level.