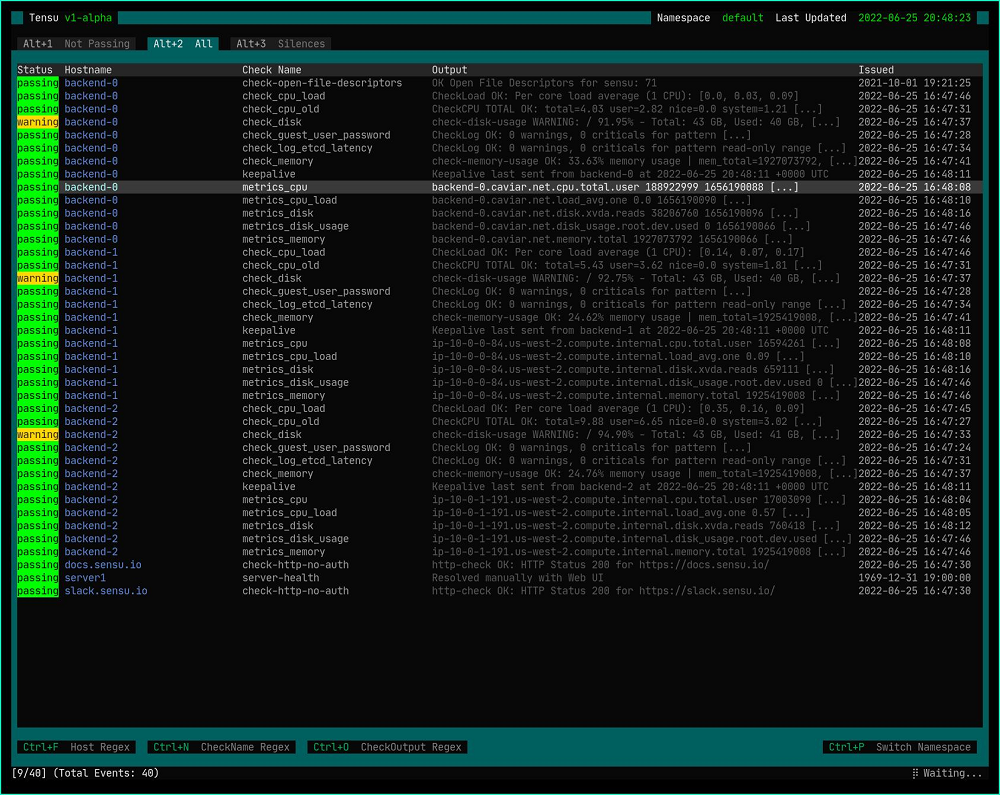
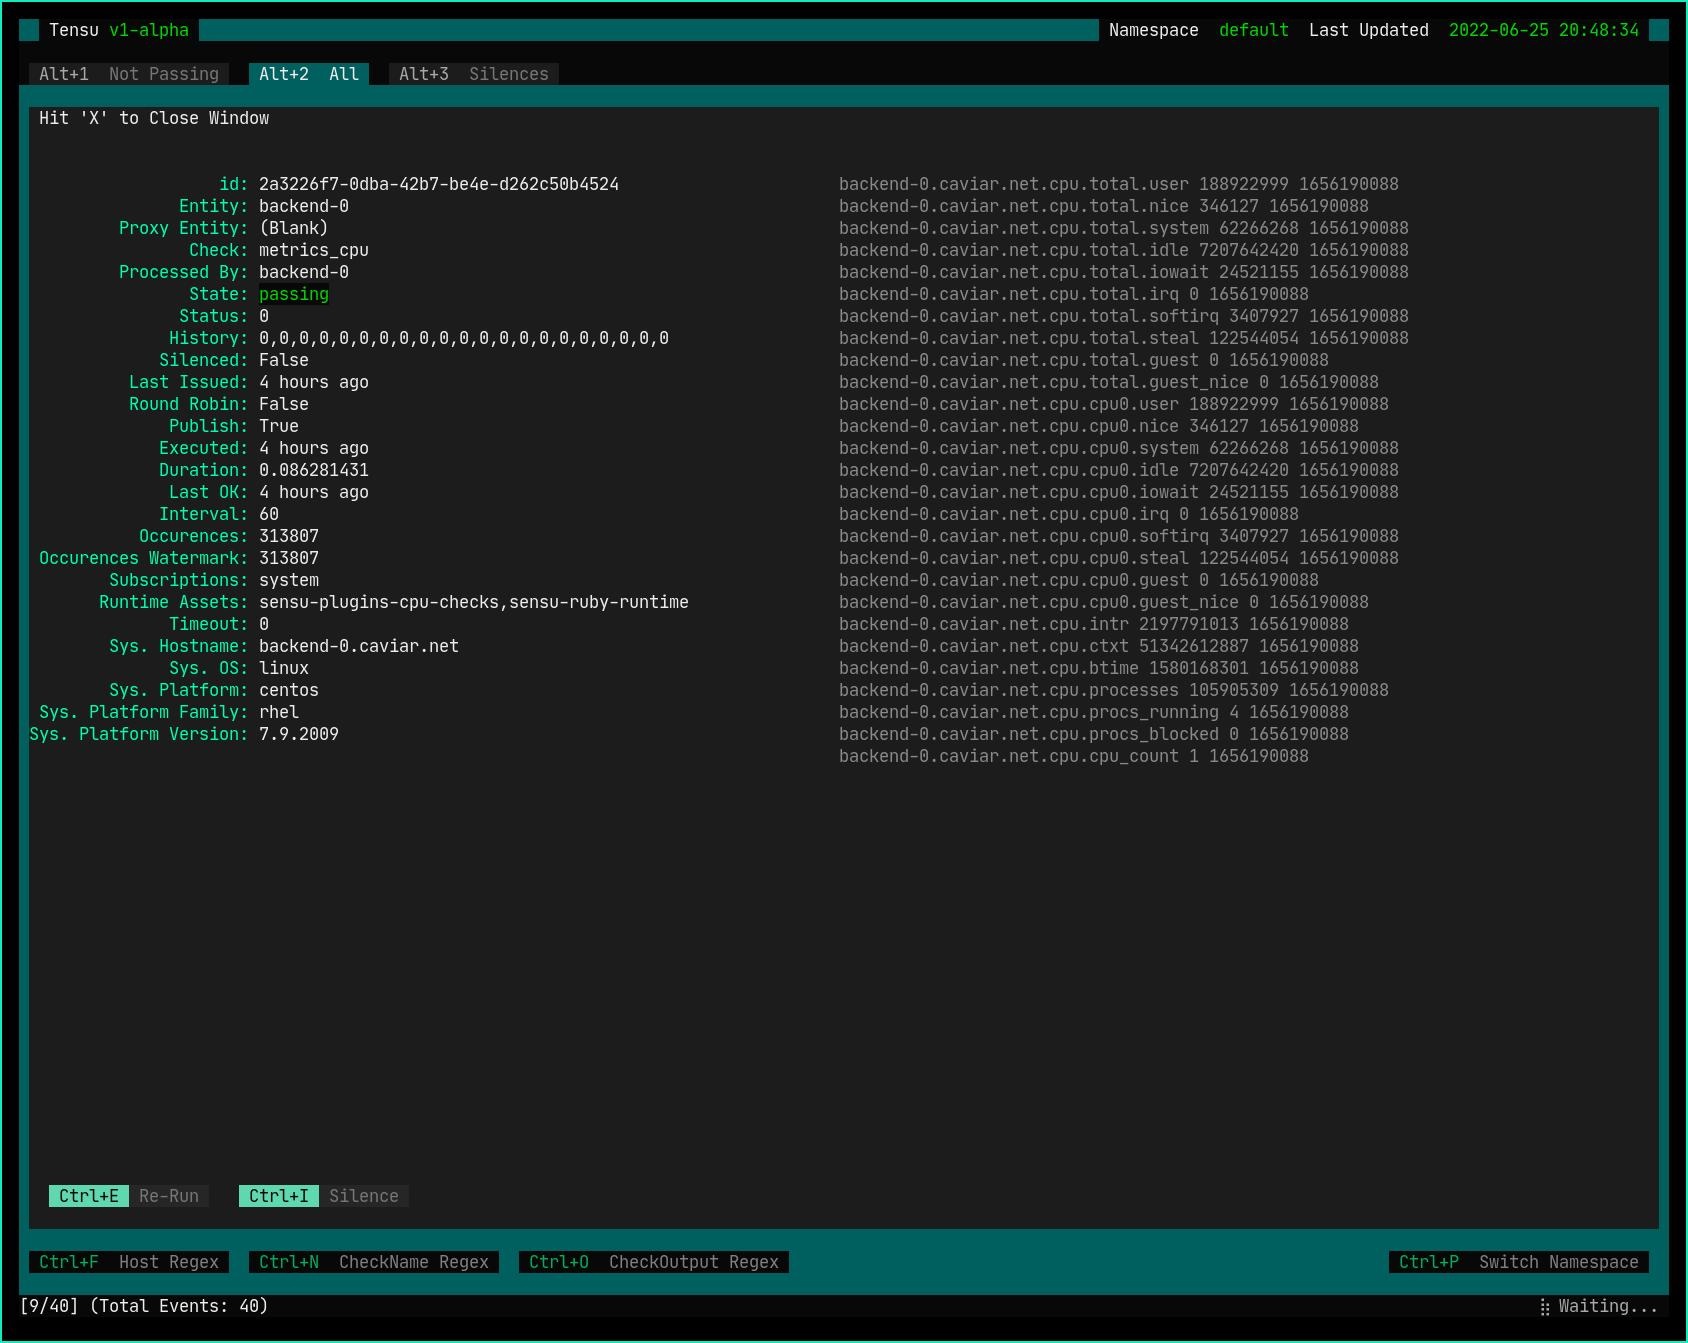
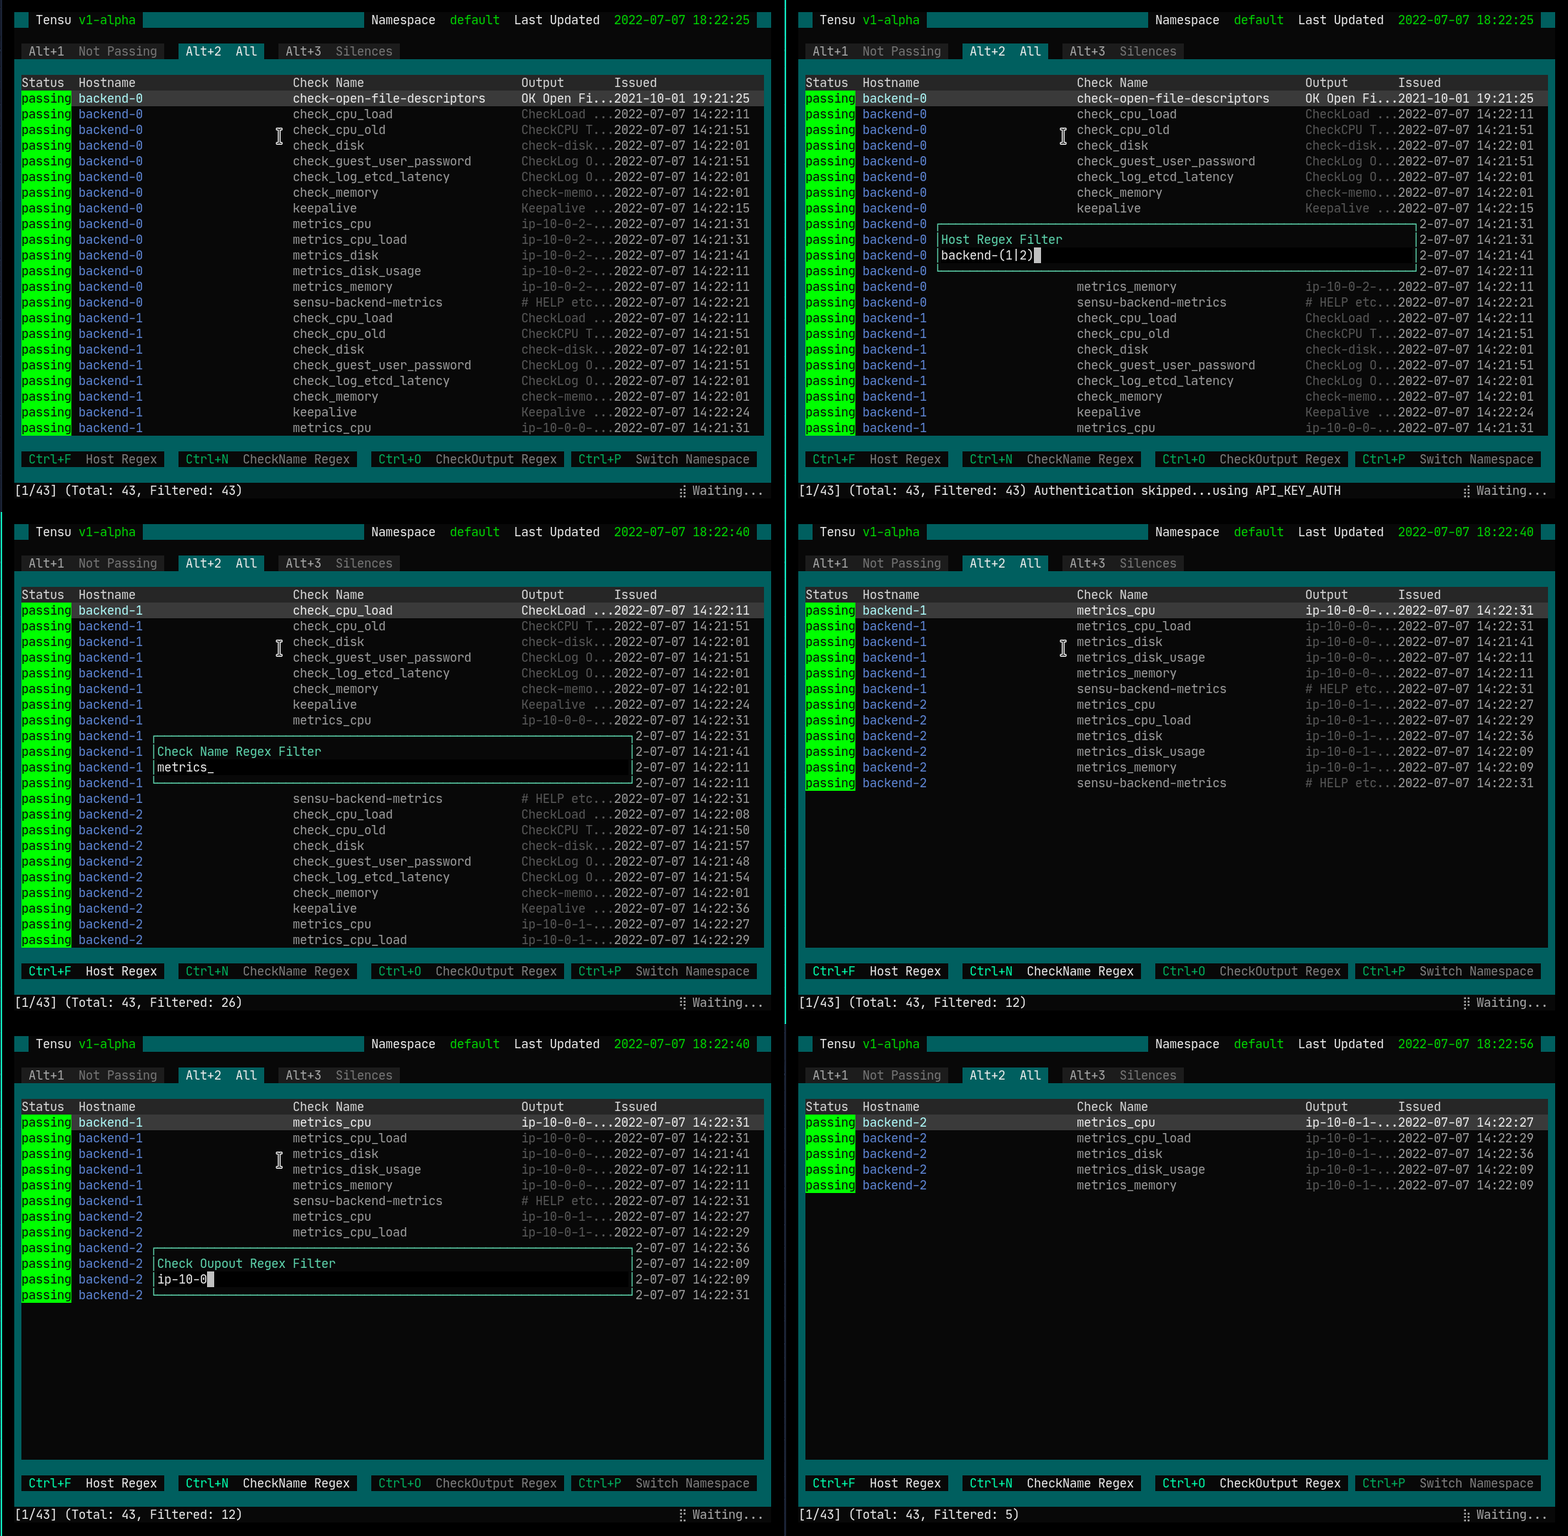
In this article we will be putting a spotlight on Tensu, an open source terminal-based dashboard for interacting with and responding to events from the Sensu Go observability pipeline and backend API. Designed by system administrators for system administrators, Tensu aims to be a robust complement to the tools provided by Sensu and a fixture on the SRE’s toolbelt. Here we will outline the features and benefits of Sensu Go, why we felt that adding a text user interface (TUI) could improve our experience with it, and our rationale and approach to building Tensu.
Sensu: The Foundation of our Monitoring Stack
A key component of a system administrator’s job is to operate, monitor, and maintain the availability of business-critical systems. For the Security Infrastructure team at Two Sigma, Sensu is the keystone of our monitoring and observability software stack. As an agent-based infrastructure monitoring tool, Sensu is designed to give administrators total visibility into their servers, containers, applications, cloud, and more.

We leverage Sensu Go on our compute platform by tightly integrating the deployment of system and application-level health checks with our virtual machine bootstrapping process and configuration management playbooks. The end result is a dynamic monitoring fabric that spans our entire compute fleet, providing us real-time observability into the state of our production systems and services.
The telemetry data we receive from the Sensu agents is transmitted to the backend servers in each datacenter, providing a stream of events that we are able to closely monitor for any check failures or undesired state changes during production deployments. A common strategy during such deployments is for an administrator to monitor a subset of checks or entities, so that any degradation can be caught immediately (even before being handed off to our pager) and action can be taken.
Why We Built Tensu
The context switching between our terminal windows and the Sensu Web UI was a bit slow and meant that data produced in either domain was out of band with each other. We could solve that problem by using sensuctl, but felt that the query syntax was not agile enough for ad-hoc drill-downs and event filtering. With these challenges in mind, we sought to create Tensu.

We thought we could build an open source tool that would make it unnecessary to leave the terminal or recall the syntax for a sensuctl command, while also delivering a subset of powerful features from the Web UI along with some traditional query semantics (like regex) for filtering and searching. Not only that, but we love Sensu. And, as a company, Two Sigma is committed to supporting open source projects. Tensu was an opportunity to give back to the community.
Tensu is a small python application that utilizes the standard curses library to draw an interactive text user interface that continually queries your Sensu Go backend API and displays real-time data about monitored events in your infrastructure. We wanted to build something that felt ergonomic and native to a system administrator who spends the majority of their time at the command prompt.
Design Approach
When designing Tensu, our vision was to make something that was:
- Fast – It should be performant and lightweight – something akin to htop in linux so that an admin could launch tensu and quickly discern the state of something and go back to what they were doing.
- Easy – It should become second nature, making use of common shortcuts like “Ctrl +F” for searching and using regular expressions for filtering data.
- Fun – It should bring joy to the user. TUIs are cool and can be an expression of creativity and art. We wanted Tensu to reflect that.
Tensu provides an event-centric catalog of your Sensu Go data. That data is automatically categorized into three main views that can be seamlessly alternated between with the use of keyboard shortcuts.
- Not Passing
- All
- Silenced
We felt designing the interface in this way was the most conducive for an at-a-glance audit of the state of your checks, while also being able to interact with events to resolve, silence, or re-execute checks. Furthermore, individual events can be inspected to show the complete set of data collected by the Sensu agent for a particular check.

Although Sensu provides a powerful query language for event filtering, we felt that searching simple events or checks was made overly cumbersome by the verbose nature of the language. In lieu of this, we chose to adopt simple regular expression matching for event filtering. Searching for events in Tensu is as easy as applying a regular expression filter to entity names, check names, or check output data. Additionally, regex filters can be layered on top of each other to easily drill down into a diverse set of events to find exactly the information you are looking for.

Summing Up
As we began incorporating Tensu as a key component of our change management process, we felt that we had more confidence in our production deployments and other major system changes. Tensu reduces the friction and mental burden of context switching between executing a change and monitoring for degradations, ultimately allowing us to focus better on the task at hand.
We look forward to continuing to develop Tensu and integrating more of the rich functionality offered by the Sensu Go API in a way that conforms to the core design philosophy of Tensu. If you would like to get involved in the further development of Tensu, please find us on Github at https://github.com/twosigma/tensu.


