
Introduction
In recent years, consciousness has continued to grow among investors worldwide regarding the connection between investment decisions and broader environmental and social issues. Additionally, investors are increasingly focused on how a company’s environmental, social, and governance policies and risks may impact the future performance of those companies’ shares.1 These dynamics have led to increasing popularity2 of ESG investing, that is, investing on the basis of Environmental, Social, and Governance characteristics.
There are a few ways investors can incorporate ESG into their processes. First, they can integrate ESG investing into their portfolios by overweighting assets with positive ESG characteristics (and underweighting or excluding those with negative ESG characteristics), or invest in funds that do so. Investors can also incorporate ESG into their risk management processes by actively managing and monitoring their portfolio’s and managers’ ESG-related risks. Finally, investors can invest with asset management firms that themselves operate with sound ESG practices at a corporate level.
In the first case, it is reasonable for allocators that hire ESG-aware or ESG-focused managers to want to be able to answer questions like:
- Are my managers that say they are incorporating ESG into their process actually doing so?
- Can I quantitatively measure the exposures my managers and portfolios have to ESG?
In this Street View, we’ll explore current ESG data at allocators’ disposal for quantitative analysis and the potential challenges with it. We start by highlighting that ESG ratings data differs substantially depending on the provider, we explore why this might be the case, and we conclude with the practical effects this has on allocators that are trying to use this data to enhance investment decisions and build better portfolios.
ESG ratings are all over the place
In the investment industry, it’s well-known and researched that ESG ratings differ substantially by provider. Dimson, Marsh, and Staunton found that “companies with a high [ESG] score from one rater often receive a middling or low score from another rater” and that correlations between ESG ratings from various providers were minimal.3 The Barclays Systematic Equity Research team also commented on the dispersion of ESG ratings in their report “Learning from Disagreement: Is Dispersion in Firms’ ESG Rankings among Providers Informative?”:
Unlike financial metrics, such as company earnings and credit default risks, ESG attributes are often intangible and qualitative in nature. More importantly, there lacks a uniform definition of the underlying measures. The subjectivity and ambiguity in what the term ESG tries to capture creates large variation in ratings across providers.4
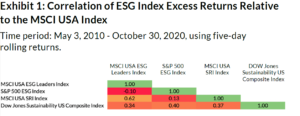
We observe the high levels of implicit disagreement when analyzing the correlations among three sample ESG index providers5:
- MSCI’s ESG Leaders and SRI indices;
- S&P’s 500 ESG index; and
- Dow Jones’ Sustainability U.S. Composite.
These indices are long-only and are focused on U.S. stocks, so we first subtract the U.S. equity market’s return6 to isolate the excess returns of these indices. We then evaluate the correlations among their excess returns. If correlations are high, that indicates that ESG definitions among providers are relatively consistent.
As we see in Exhibit 1 below, the average excess return correlation across these indices is only 30% for the 2010-2020 period. The highest excess return correlation was between the indices of the same provider—MSCI. There was even one correlation that was negative over the entire decade, and it was between two major index providers, MSCI and S&P, that are attempting to capture the same idea: positive ESG stocks in the U.S. universe.
How do these results compare to more established factors like Value and Momentum? We’ll do the same exercise for both of these factors separately, again using well-known index providers and removing the general market’s return to isolate the risk and return coming from investing in these factors. We see in Exhibit 2 that the average correlations are much higher at 92% and 70% for Value and Momentum, respectively.
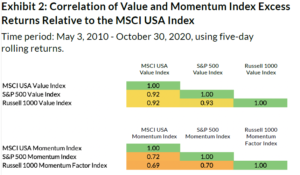
Value and Momentum factors exhibited high excess return correlations indicating agreement amongst the various index providers on how to measure Value and Momentum. The agreement is especially impressive for the Value factor because of the many ways to define Value (e.g., price-to-book, dividend yield, and earnings yield), which can be very lowly correlated with one another, as we demonstrated in our 2016 Street View “Risk Factors Are Not Generic.”7 The Value indices we use in this correlation matrix combine multiple Value metrics to determine a stock’s Value exposure, indicating that index providers appear to agree on how to measure Value (by combining multiple definitions) to such an extent that their excess return correlations are still meaningfully high.
So, why is there dispersion in ESG ratings?
First, as captured in the Barclays quote earlier, ESG definitions are largely non-standardized. While this lack of standardization likely contributes to the ratings dispersion, there might also be the desire to differentiate. ESG ratings providers may want to provide a unique view into the ESG characteristics of companies by not only using limited public data, but also by creating unique models and leveraging unique data sets.8 There might be a parallel to commonly held discussions around the “risk premia” investment strategy. Academics and practitioners alike sought to differentiate themselves and add unique value by identifying new risk premia. There resulted in a “zoo” of factors that investors had to make sense of.9 And even within an established factor like Value, there emerged several ways beyond the canonical metric (price-to-book, in the case of Value) to capture a theme.
Second, there can be design differences in how providers construct their ESG portfolios. Similar to the view we expressed in our 2020 Street View, “How Design Choices Impact Low Risk Factor Performance,” seemingly innocuous specification details for a factor (or any portfolio, really) can have a surprisingly large impact on performance. One such design choice in the ESG space is how to weight the E, S, and G components. Providers may for whatever reason have a unique view on how these three components should be weighted in an overall ESG score. For example, MSCI has highlighted that Governance is foundational to an ESG score, as it’s universally applicable across all industries, and should be at least a third of a stock’s total ESG score at any point in time.10 So even if providers have the exact same E, S, and G ratings for every individual security, there could be differences in how providers weight the three components.
Take a stock that scores highly on the E dimension, but lousy in S and G. If a provider weights E heavily, that stock could be a top holding in their ESG portfolio, while another provider (using the same definitions for E, S, and G) weights the components differently and ends up with a different score such that the stock has an overall negative score and is shorted or underweighted.
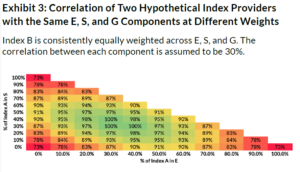
Let’s further explore the impact of weighting differences with hypothetical ESG indices. Consider the portfolios of two index providers, Index A and Index B, that allocate to the exact same E, S, and G sub-portfolios, but at different weights. This represents the “best case” scenario where the two providers are fully aligned on how to define E, S, and G.
The only difference between the two providers is how the three components are weighted. First, a couple of assumptions we need to make:
- The correlations between E, S, and G are 30% each.
- The volatilities of E, S, and G are 10% each (about the same volatility as a 60/40 stock/bond portfolio).
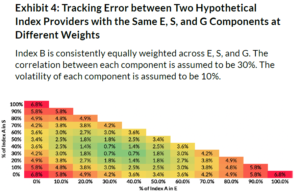
Let’s keep Index B at equal weights (i.e., 33% weights to each of E, S, and G) and vary the weights for Index A. We then measure the return correlations and tracking errors between the two index providers. We find that at the extremes (i.e., when Index A is 100% allocated to E, S, or G), the two providers have an ~70% correlation and ~7% tracking error (again, using 10% volatilities for each of the three components). In other words, a one standard deviation event would be one index outperforming the other by 7% over a yearlong period.
So even if providers used the exact same E, S, and G definitions, how they combine them to form their aggregate ESG indices can still cause correlations between providers to be meaningfully far from 1 and tracking errors to be quite high.
Third, and perhaps most important, ESG is a muddy concept. If we take a step back, is there any common conceptual theme that is really linking E, S, and G? Are E, S, and G more like the components within a Value factor (price-to-book, price-to-earnings, and price-to-sales), supporting the idea that combining them results in one, unified factor? Or are E, S, and G more akin to completely different factors like Value, Momentum, and Quality, such that combining them is more like forming a VMQ multi-factor portfolio?
Let’s first present the case for why E, S, and G should be grouped together under one related theme. One could argue that there is a common underlying factor or factors that tie these three concepts together. For example, company management teams might care enough about these issues such that they prioritize all three initiatives across their companies. Another common underlying factor might be sustainability—an indication of whether the company can survive long-term. Can the company weather climate change (pun intended)? Can it attract diverse talent to innovate? Does it have a strong governance structure that effectively balances the interests of its various stakeholders?
However, while these are important questions to consider when making an investment decision, they can easily be mutually exclusive, which may support the premise that they shouldn’t be grouped together. That is, E, S, and G are very different, individual ways of describing an investment so treating them separately may be more appropriate.
To provide a hypothetical example of why E, S, and G shouldn’t be grouped together as one single factor, consider an electric car company. On the surface at least, the company’s product might be great for the environment long-term. But upon closer examination, the company’s international labor standards may be deficient, and a single shareholder possesses enough voting rights to singlehandedly make key corporate decisions. Depending on how one weights the components, the stock could rate average or even poorly on ESG in aggregate. An investor would then lose the strong positive environment score—information we think is worth knowing about the stock on a standalone basis.
Therefore, E, S, and G might be more akin to distinct factors like Value, Momentum, and Quality. There’s still value in combining them together in a multi-factor portfolio to get a well-rounded view of a stock, but these views can be distinct and evaluated separately.
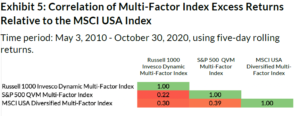
As we showed in Exhibit 2 above, correlations among index providers for a single, relatively well-established factor like Value or Momentum are high. However, when those same index providers combine multiple, distinct factors to form indices, we find that their excess return correlations are much lower. For example, Exhibit 5 shows the multi-factor indices for MSCI, S&P, and Russell, which target exposure to some combination of Value, Momentum, Quality, Low Risk, and Size. Their average excess return correlation was only 30% over the 2010 – 2020 period, which is exactly the average excess return correlation we found for the ESG indices earlier and is much lower than the average excess return correlations for the standalone Value and Momentum indices (92% and 70%, respectively).
Conclusion
In summary, ESG ratings vary a lot depending on the provider. Idiosyncrasies in the providers’ rating methodology and/or differences in weightings among the components of ESG could contribute to this ratings dispersion. Given this dispersion, what are the potential implications for asset allocators that want to quantitatively measure their ESG exposure?
Using one of these ESG indices to benchmark performance for a manager or portfolio (by measuring things like correlations, betas, excess returns, or tracking errors) is not robust because the results of that analysis are dependent on which index is used, far more so than would be the case for selecting between indices that track U.S. large cap stocks (e.g., Russell 1000 vs. S&P 500) or equity style indices (e.g., MSCI USA Momentum vs. Russell 1000 Momentum).
Just as relative performance statistics can be especially sensitive to the ESG benchmark, exposures to ESG using holdings-based analysis could be sensitive to the ratings provider. That is, if using “out-of-the-box” ESG ratings for individual securities and aggregating them up to a portfolio level to understand a fund’s ESG exposure, that analysis too will be dependent on which provider is used for the ratings, and therefore could produce different results (potentially directionally different results).
So where does this leave the allocator that is trying to quantitatively assess their ESG exposure? We still believe there is a path forward: we’d recommend at least starting this analysis by first working to develop one’s own ESG values and then deeply diligencing the investment manager’s and ESG data provider’s methodologies to make sure they align with those values.
Finally, one can avoid much of the dispersion that results from weighting differences across providers by analyzing E, S, and G separately (instead of viewing them in aggregate). All three components of ESG might be worth considering when making an investment decision, but because they each carry their own unique risks, they can be evaluated independently. This way, an investor wouldn’t lose a valuable signal from one of the components or miss an important risk exposure that would potentially be hidden when viewing in aggregate.
Please see Appendix in the PDF version of this article for additional information.