“History,” writes journalist and historian Eduardo Galeano, “never really says goodbye. History says, see you later.” Echoing this sentiment, investors and market observers have long used the study of past markets as a way to gauge conditions today and guideposts for the ever-murky future. A wide variety of researchers’ scorecards, barometers, and dashboards aim to understand what previous period the current moment most “looks like.” It is a common and valid exercise. Without some rigor and breadth, however, many historical comparisons are blunt instruments at best.
With credit spreads near cyclical lows, interest rates beginning to rise again, and the return of equity volatility, this seems like a natural time to look back at market history and see which part of previous market cycles most resemble today’s environment. In an effort to build a broad, more rigorous measure, many diverse indicators of the economic and market environment can be used to build a weighted measure of the “distance” between the present and each month since January 1990.
Building a 24-dimensional model
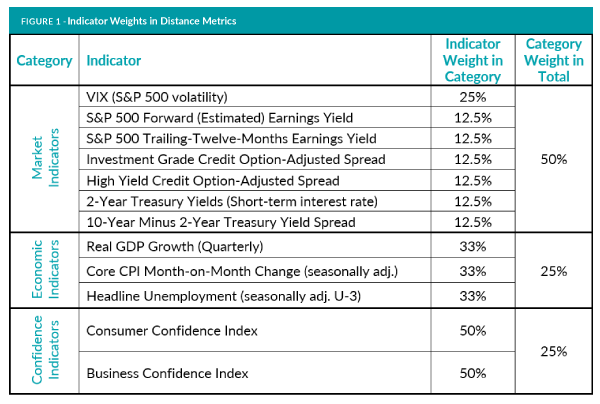
For a foray into historical market comparisons, let’s start with a diverse panel of U.S. financial environment measures. Figure 1 shows the full array of indicators selected, with a cross-section of valuation and spread measures across key asset classes, as well as inflation, GDP growth, unemployment, and confidence survey measures. For each indicator, one can calculate two sub-indicators: level relative to the long-term history and the rate of change relative to the trailing year. Both measures matter, as for example a market where credit spreads are relatively low and still tightening could represent quite different conditions from one where credit spreads are at identical levels, but have been rising in anticipation of declining credit quality.

To add a bit more structure to the distance metric, one approach is to standardize every indicator to have a historical mean of zero and standard deviation of one¹, then apply reasonable rule-of-thumb weights to the different indicators. Market-driven measures tend to have more timely data and represent forward-looking views of investors, so it seems reasonable to give market category a 50% weight in the total metric versus 25% each for the economic and confidence survey categories. Within each category, one can equal-weight the various indicators (and their level and rate-of change sub-measures). The sole exceptions are the level and rate-of-change of the VIX index, which were given double weights, as the VIX index was the sole indicator for the volatility asset class.
With standardized metrics of level and change for each indicator, the result is a 24-dimensional space where every month in the measurement period is represented as a single point. By measuring the weighted Euclidean distance between the April 2018 point and all others, one can estimate how similar or different—relatively— the environment today is to all other periods going back to 1990.
What previous periods does today most look like?
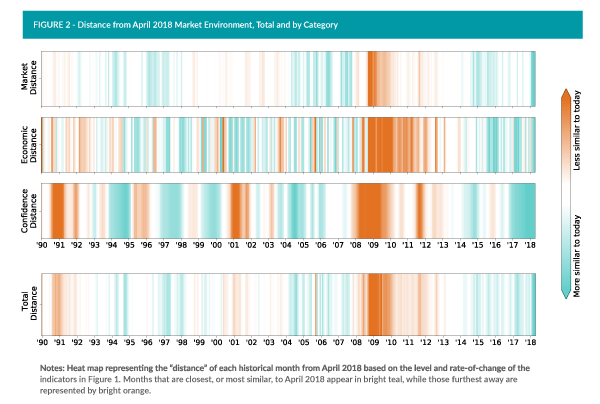
A visualization (Figure 2) of the results of the analysis shows that overall market, economic, and confidence conditions appear to most closely mirror those of the late 1990s, mid-2000s, and much of the last three years. America’s long-running economic expansion has led to fairly steady growth, low unemployment, high confidence for both businesses and consumers, and the relatively higher market valuations that accompany those conditions. Perhaps the larger surprise is that there do not appear to be very close parallels to the 1999-2000 “irrational exuberance” market or the 2008 tumult immediately preceding the Global Financial Crisis.

Indeed, the recent jump in equity market volatility may have been frightening after the deafening silence of 2017, but it’s easy to forget that the VIX hit an intraday high of 53 as recently as August 24, 2015 when investors’ list of concerns included a potential Chinese economic slowdown and the end of the Fed’s quantitative easing. Current valuations and volatility do not appear uncommon for a mid- to late-stage bull market, while rate-of-change metrics and leading indicators like confidence surveys still appear positive (in contrast to their declining levels in 2007-2008). The broad measure of market similarity suggests that today, like so much of the past few years, the market is climbing the “wall of worry” that continually lies ahead even as yesterday’s fears diminish.
This comparison with past markets may appear relatively comforting, but markets always have a way of surprising. No analysis is complete without looking for disconfirming evidence, and the Confidence metrics in Figure 2 suggest that one will not always see the troubles ahead. Although businesses and consumers grew wary before the Global Financial Crisis, confidence surveys showed no such foresight in the Tech Bubble; measures remained elevated until the market had already turned the corner and begun a twoyear decline. Even if the skies look relatively clear for now, the rains can come at any time.
Implications for allocators
Although the past never repeats exactly, historical studies may still help investors keep today’s events in perspective and prepare for the more likely futures. Statisticians encourage a disciplined approach to this exercise, favoring broad and diverse views of the market environment over focus on isolated data points that might mislead as much as they illuminate. The trick potentially lies in how to combine such broad and sometimes conflicting data into insightful metrics. Statistical approaches to measuring similarity between today’s market, economic, and confidence indicators and those of past periods may provide a way for allocators to quantify which types of previous conditions may be ready to “say hello” once again.
Appendix


