
Relatively few asset allocators share their point forecasts and investment strategies, but US public pension plans offer a notable exception. These plans annually publish their portfolio return expectations and asset class allocations, generating a large data set. The Public Plans Data (PPD) from Boston College’s Center for Retirement Research conveniently makes this data accessible.1
Market participants may try to mine wisdom from this crowd, but caution seems warranted. An analysis of the data highlights an inverse relationship between pension plans’ funded ratios and return assumptions. In other words, the pension plans with the worst historical track record in meeting their funding obligations tend to maintain the loftiest expectations for future returns. Across the 160 plans in the data set, a 20 percent decrease2 in the funded ratio3 tends to increase return expectations by approximately 7.4 basis points. Lower funding status also appears associated with lower propensity to reset expectations.
Evaluating appropriate return expectations for individual pension plans remains a topic for policy makers and outside the scope of this market commentary. However, helping identify insights and potential biases embedded in the aggregate pension plan data may help market participants trying to tackle the hard problem of asset allocation.
Inverse relationship between funded ratios and return expectations
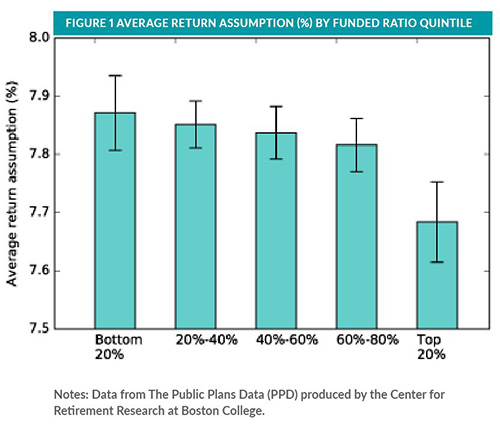
Figure 1 shows the average return assumptions of US pension plans from 2001 to 2015, grouped by funded-ratio quintiles. As funded ratios increase, average return assumptions decrease. The plans in the lowest 20 percentile for funding ratio hold return expectations 19 basis points higher than plans in top quintile for funding ratio, and this difference is statistically different from zero. Given that long-term return expectations of public pension funds have declined approximately 40 basis points since 2001,4 the differences in return assumptions among the most and least adequately funded pensions also appear economically meaningful.
More rigorous statistical testing supports the intuition from Figure 1—pension plan funding status and return assumptions appear inversely related. Table 1 (Panel A) reports the results of a panel regression of the investment return assumption on four factors (controlling for time fixed-effects for a cross-section of US public pensions from 2001 to 2015): funded ratio, 10-year investment return, logarithm of actuarial assets, and the allocation made to risky assets.⁵ The table indicates that a 20 percent decrease in funded ratio increases the return expectations of pensions by 7.4 basis points.
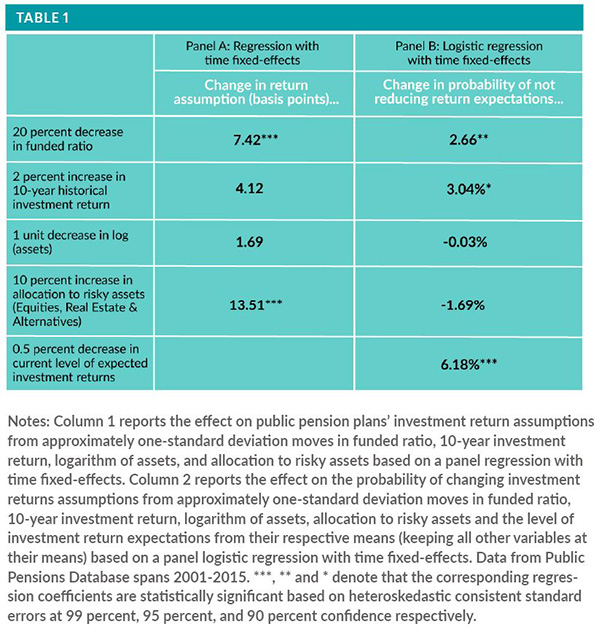
This inverse relationship exists even after controlling for potentially confounding factors like historical return levels, pension plan size, and allocation made to risky assets. The historical returns and size of the pension plan have a positive relationship to return expectations, but the result is not significant. Not surprisingly, the risk tolerance of the pension plan, proxied by the allocation to factors like equity and real estate, has a positive and statistically significant coefficient. A 10 percent increase6 in allocation made to risky assets (Equities, Real Estate, and Alternatives) increases the return expectations of pensions by 13.5 basis points. In sum, the results show that two plans with similar allocations will have different return assumptions if their funded status levels vary.7
Not only do pension plans with lower funding ratios make relatively more optimistic forecasts about future returns, they have historically proven less willing than their peers to lower their forecasts over time. Table 1 (Panel B) also shows the results of a panel logistic regression of the probability of not reducing investment return assumptions on funded ratio, 10- year investment return, logarithm of actuarial assets, and the current level of expected investment returns. A 20 percent decrease in funded ratio (accounting for time fixed-effects and controlling for the other variables) makes it 2.7 percent less likely the fund will reduce its return assumption.8 Similarly, plans with relatively low expectations for future returns seem less likely to reduce their expectations further. Plans with 0.5 percent9 lower return expectations appear 6.2 percent less likely to reduce their return assumptions than otherwise comparable plans. Since only 15 percent of plans reduced their return expectations in any given year between 2001 and 2015, the magnitude of these estimated probabilities appears economically meaningful.
Potential implications
The return forecasts of US public pension plans offer another example of hope triumphing over experience. The average pension plan expects to generate 7.6 percent per year, even though the average plan only realized a 5.7 percent return per year from 2001-2015. The low levels of returns over this period reduced the funding status for many plans from 99 percent in 2001 to 74 percent in 2015. However, the plans with the largest shortfalls still tend to have the highest expected future returns and the lowest willingness to reduce those expectations.
Accounting rules may explain some of this apparent inconsistency. Public pensions discount their liabilities based on their expected rates of return, so reducing those expectations would negatively affect funded ratios. These assumptions embody structural optimism. This optimism is persistent across time, as pensions with lower funded ratios appear less likely to reduce their investment return assumptions each year than their more successful counterparts. Market participants trying to glean insights from the crowd of public pension plans might want to keep this bias in mind.